Executive Summary
ISO PNode counts for the 7 US ISOs were relatively modest during the most recent Quarter, growing by 688, 628 Load, and 60 Generation. This brings the total PNodes in Clarity’s library to 77.121 nodes. Unlike previous quarters, there we no new Utility Systems added to either the CAISO or SPP EIM markets dampening the number of new PNode additions. Still every ISO region registered an addition of both Gen and Load nodes with the exception of NEISO. If we account only for truly “newly constructed” capacity for either Load or Gen, only PJM, MISO, ERCOT and CAISO added generation capacity, while a storage asset was added to NYISO. As for Load (Substations) all but NEISO and SPP added newly constructed facilities. In terms of megawatts of generation capacity. Solar additions led in aggregate at 3.386 mws and Wind added 991 mws,. Solar additions were seen in ERCOT, CAISO and MISO, Wind in ERCOT and MISO. In addition, 970 mws of Storage were added led by additions in CAISO (655 mws) and ERCOT (310 mws) respectively.
Background
While other surveys of US Electric Grid activity publish statistics highlighting additions to grid infrastructure, most notably renewable generation and storage, Clarity Grid focus intently on key metrics published by the 7 US ISOs, specifically Price Node (PNode) counts. To reiterate from previous Blogs, Pndes are published by the ISOs so that cash can be exchanged (settlements) between market participants and therefore are of utmost importance. Once published a PNode can serve as the “key” to unlock economic information at a given Load or Generation location. Unfortunately, this PNode information is usually cryptic and lacks locational information which is where Clarity Grid’s service becomes important. We survey all ISO information daily and update this information usually quarterly although changes can occur in our database at any time should we need to modify the information. In addition to locational information, we accompany our locational data with “metadata” including, for Load: Utility ownership, interconnecting Transmission Line Capacity (kv) and Anchor Tenants, and for Generation: Fuel Type, Ownership, and Mw/Mwhr Capacities. In addition to GIS based views of all of our data via our User Interface, this metadata provides a context for grid infrastructure information which is valuable to a wide array of grid stakeholders, including: developers, consultants, researchers, landowners, traders and utilities.
Clarity PNode Additions
As described in previous Blog postings, it is important to understand the context of new PNode additions on a quarterly basis. New Price Nodes may appear or several reasons: 1) Additions to existing infrastructure (either Load or Gen) may require new PNodes to be issued, 2) Previously existing infrastructure (almost exclusively Load) will be assigned a PNode for the first time to facilitate price discover, or 3) Truly New Price Nodes are issued for infrastructure which is now, or soon will be, introduced on the Grid. It is this last category which is probably the most relevant in terms of describing how the nature of the Grid is changing. It is obvious on the Generation side why this would be important, but the addition of new Load points (Substations) can uncover the arrival of new manufacturing, data centers, or distribution warehouses which tell an interesting story about economic activity on a larger scale. We will highlight some of those instances below.
The distinction between newly added and truly new additions can be seen by comparing the 2 Charts below:
Chart 1
3Q 2023 Notional Node Additions
|
NYISO |
NEISO |
PJM |
MISO |
SPP |
ERCOT |
CAISO |
Total Fuel Type |
|
|
Solar |
0 |
0 |
11 |
2 |
0 |
6 |
6 |
25 |
|
Hydro |
0 |
0 |
0 |
0 |
0 |
0 |
0 |
0 |
|
Natural Gas |
0 |
0 |
2 |
1 |
0 |
1 |
0 |
4 |
|
BM |
0 |
0 |
0 |
0 |
0 |
0 |
0 |
0 |
|
Battery |
1 |
0 |
0 |
1 |
0 |
2 |
21 |
25 |
|
Wind |
0 |
0 |
0 |
3 |
0 |
3 |
0 |
6 |
|
Coal |
0 |
0 |
0 |
0 |
0 |
0 |
0 |
0 |
|
Distillate |
0 |
0 |
0 |
0 |
0 |
0 |
0 |
0 |
|
Geothermal |
0 |
0 |
0 |
0 |
0 |
0 |
0 |
0 |
|
Total ISO |
1 |
0 |
13 |
7 |
0 |
12 |
27 |
60 |
|
NYISO |
NEISO |
PJM |
MISO |
SPP |
ERCOT |
CAISO |
Total Load |
|
|
Load |
1 |
0 |
143 |
218 |
48 |
176 |
42 |
628 |
Chart 2
3Q 2023 Newly Constructed Node Additions
|
NYISO |
NEISO |
PJM |
MISO |
SPP |
ERCOT |
CAISO |
Total Fuel Type |
|
|
Solar |
0 |
0 |
10 |
2 |
0 |
6 |
6 |
24 |
|
Hydro |
0 |
0 |
0 |
0 |
0 |
0 |
0 |
0 |
|
Natural Gas |
0 |
0 |
0 |
0 |
0 |
0 |
0 |
0 |
|
BM |
0 |
0 |
0 |
0 |
0 |
0 |
0 |
0 |
|
Battery |
1 |
0 |
0 |
0 |
0 |
2 |
21 |
24 |
|
Wind |
0 |
0 |
0 |
3 |
0 |
3 |
0 |
6 |
|
Coal |
0 |
0 |
0 |
0 |
0 |
0 |
0 |
0 |
|
Distillate |
0 |
0 |
0 |
0 |
0 |
0 |
0 |
0 |
|
Geothermal |
0 |
0 |
0 |
0 |
0 |
0 |
0 |
0 |
|
Total ISO |
1 |
0 |
10 |
5 |
0 |
11 |
27 |
54 |
|
NYISO |
NEISO |
PJM |
MISO |
SPP |
ERCOT |
CAISO |
Total Load |
|
|
Load |
1 |
0 |
31 |
24 |
0 |
56 |
1 |
113 |
As can be seen from a comparison of the 2 Charts, while notional additions grew by 688 (628 Load and 60 Gen) newly constructed nodal points only registered 167 (113 Load and 54 Gen). This was due to most additions to Load occurring due to the addition of PNodes to preexisting infrastructure in MISO, ERCOT, and CAISO.
Newly Constructed Generation (Storage) by Fuel Type
Examining only PNode additions is obviously insufficient when trying to understand the impact on the Grid of infrastructure additions, the size (mw or kv) must also be understood. As mentioned, the largest growth in both generation as well as storage assets has been “distributed” which by definition is smaller in scale.
Chart 3
3Q 2023 Newly Constructed Node Additions (mw)
|
NYISO |
NEISO |
PJM |
MISO |
SPP |
ERCOT |
CAISO |
Totals |
|
|
Solar |
0.00 |
0.00 |
703.00 |
244.90 |
0.00 |
1647.50 |
791.00 |
3386.40 |
|
Hydro |
0.00 |
0.00 |
0.00 |
0.00 |
0.00 |
0.00 |
0.00 |
0.00 |
|
Natural Gas |
0.00 |
0.00 |
0.00 |
0.00 |
0.00 |
0.00 |
0.00 |
0.00 |
|
BM |
0.00 |
0.00 |
0.00 |
0.00 |
0.00 |
0.00 |
0.00 |
0.00 |
|
Battery |
3.00 |
0.00 |
0.00 |
0.00 |
0.00 |
309.95 |
658.00 |
970.95 |
|
Wind |
0.00 |
0.00 |
0.00 |
532.93 |
0.00 |
767.50 |
0.00 |
1300.43 |
|
Coal |
0.00 |
0.00 |
0.00 |
0.00 |
0.00 |
0.00 |
0.00 |
0.00 |
|
Distillate |
0.00 |
0.00 |
0.00 |
0.00 |
0.00 |
0.00 |
0.00 |
0.00 |
|
Geothermal |
0.00 |
0.00 |
0.00 |
0.00 |
0.00 |
0.00 |
0.00 |
0.00 |
|
Generation |
0.00 |
0.00 |
703.00 |
777.83 |
0.00 |
2415.00 |
791.00 |
4686.83 |
|
Storage |
3.00 |
0.00 |
0.00 |
0.00 |
0.00 |
309.95 |
658.00 |
970.95 |
Slightly exceeding generation capacity additions last quarter, almost 4.7 GW of generation and almost 1 .0 GW of storage was added to the Grid from a PNode perspective. As we have seen over recent quarters, Solar additions dwarfed Wind additions (3,386 mw vs 1,300 mws) while Storage additions were again centered around CAISO and ERCOT,658 and 310 mw respectively. It is noteworthy that while ERCOT storage activity generates the most current interest we see, CAISO dominates newly constructed facilities from a total mw standpoint.
Noteworthy Examples of Generation Additions:
NYISO
As was seen last quarter NYISO Storage activity has picked up. The most recent addition was Key Capture’s 3.0 mw/mwhr battery system in Pomona NY.

PJM
Contributing to PJM’s 703 mw of Solar additions during the third quarter was Dominion Power’s 80mw solar facility in Emporia, VA shown below.

MISO:
Wind capacity totaling 600 mw was added in MISO during Q3 2023, 2 additions to previously existing wind farms, Buffalo Ridge (200 mw) and Deuel Harvest (200 mw), as well as newly constructed Great Pathfinder Wind owned by Apex Clean Energy in Interstate Power’s Iowa territory (224 mw) shown below, note negative RT price.

ERCOT:
Three new wind farms gained PNode status adding 767 mw to the ERCOT Grid including: Canyon Wind (250 mw), Road Runner Crossing (256 mw) and Engie’s Sheep Creek (151 mw) shown below:

Solar led ERCOT additions to the generation stack in terms of number of new projects coming online at 6, and mws of capacity totaling 1,647 mw including Engie’s Sheep Creek Wind Project (151 mw):
Finally on the Storage side, ERCOT say Plus Power’s large scale Rodeo Ranch project come online in 3Q at 300 mw/600 mwh just north of TNP Worsham Field Substation:

CAISO
CAISO saw several new Solar facilities come online in the 3rd Quarter ranging in size from 3 mw to 200 mw and exclusively in the state of California (CAISO) as well as Arizona (CAISO EIM). Most large facilities, McFarland, Antelope 2 Estrella and Raceway were sited as both Solar and BESS (Battery). Profiled below is Clearway Energy Group’s 200 mw Solar facility in Desert Center Ca which also includes 186 mw of collocated battery storage:

CAISO led all ISOs in new battery additions at 658 mw over the quarter, many of the larger installations collocated with Solar as described above. However not all newly constructed battery additions were large as seen from Hectate Storage’s Carris Storage unit in Palm Springs (10mw/mwhr):

Noteworthy Examples of Load Additions:
As described earlier, while much attention is given to generation/storage additions to the Grid, much can be learned about growth in the broader economy as well as new large loads such as manufacturing facilities, distribution warehouses, as well as data centers. Also, large new substations may be fertile ground for sitting of new large loads such as green hydrogen and bitcoin mining.
PJM:
One of the strongest drivers of substation growth recently has not surprisingly been to serve large loads for new data centers. The Loudon County area of Northern Virginia has seen the strongest proliferation of data centers recently and that trend shows no indication of slowing down. Dominion’s DTC Substation, served from a 230 kv line and encompassing five 34.5 kv transformers. There are several existing data centers in the area, Cyrus One and Cyxtera, however this substation is most probably constructed to serve a new customer EdgeCore which is due to be operational on Atlantic Avenue near the DTC Substation.

MISO:
In Entergy New Orleans territory Sullivan Substation was constructed to serve the Sewage and Water Board of New Orleans (SWBNO) Carrolton site. This Substation is listed at 60 mw of capacity and is interconnected. By a 115 kv transmission line stepped down to 34.5 kv distribution circuit.

ERCOT:
Introductions of new solar, wind or battery projects usually accompany a new substation which ERCOT categorizes as Load, as was the case over the most recent quarter. This was the case with Birddog Switch which serves the collocated Noble Solar Facility in Krum, TX and is interconnected to Oncor’s 345 kv transmission line.

CAISO:
As was the case with ERCOT, most new Substation (Load) construction took place in the 3rd Quarter to support new Solar and or Battery installations in CAISO. Venturing out to CAISO EIM there was new substation construction in Tucson Electric’s territory as Patriot a 138 kv facility was brought online to support new load growth at Davis-Monthan AFB. Images are from our Bing based GIS view and Google Maps showing substation displacing aircraft:
")
")
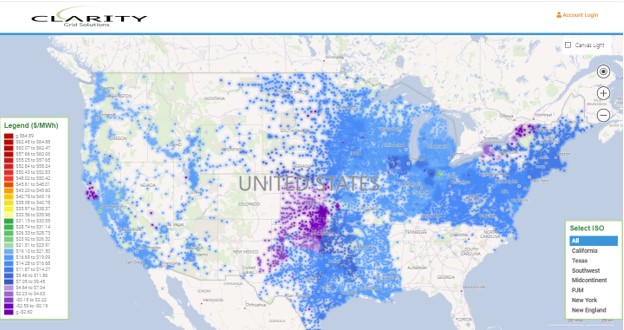
Lastly, following up from last Quarter’s discussion of the limitations of our satellite views on our Bing Maps based GIS platform and partnership with Skyfi. After some fits and starts in placement of the logo and instructions we have finally added the logo in the lower right corner of all map views just above the Real Time Energy/Congestion Colar Mapping Grid (see below). If you click the Skyfi logo you will be redirected to their site where you will receive instructions for sign up and entry of lat/long coordinates for satellite view selection.

If you are interested in viewing all existing and new load and gen facilities, please inquire about a trial at https://www.claritygrid.net and select “Request a Demo.”