Executive Summary
ISO PNode counts for the 7 US ISOs grew by 1,311 during the first Quarter of 2023, 1,077 for Load and 234 for Generation, bringing Total PNode counts in Clarity’s database to over 75,000. Additions were largely driven by the introduction of transmission, distribution, and generation assets of new Extended Energy Market (EIM) members in CAISO. Also, in keeping with the trend of recent quarters, ERCOT added significantly to both its Load (Substation) infrastructure as well as Generation mix with predominantly new solar and battery assets. Rounding out the mix the large PJM and MISO regions did see noteworthy new additions to both Load serving and Generation assets.
Background
For those unfamiliar with the operations of the wholesale energy markets in the US, Independent System Operators (ISOs) are quasi-governmental agencies charged with managing the flow of electricity on the wholesale electric grid both safely and at the lowest cost. The models which ISOs use to schedule these transactions are frequently referred to as SCED or Security Constrained Economic Dispatch, emphasis on Security and Economic. This process is run much like an auction, administered by the ISOs, in which grid stakeholders: suppliers (generators), transmission entities, and those parties serving customers (load) all submit bids for which they are willing to transact for either the following 24-hour day (Day Ahead), or the next 5 minutes (Real Time). The price that all parties agree to transact is made public and available from the respective ISO’s website, but in an opaque form known as a PNode, or Price Node. This reflects the official price as certified and cleared by the ISO at which the sale, or purchase of power takes place at a discrete location. Because the value of electricity is defined only by its location, and storage of electricity was difficult and or uneconomic until recently, it is very important to match the published price at a PNode and its location. Unfortunately, the structure of PNode information makes it very difficult to interpret and often various types of metadata are required to understand the context of the price for a PNode, to begin to decipher its role on the grid and or location. Some PNodes only reflect the average value for many discrete locations across a geographic region (Zones) or for a group of related generation stations (HUBs), some simply measure flows of electrons at a point (Interfaces), etc.
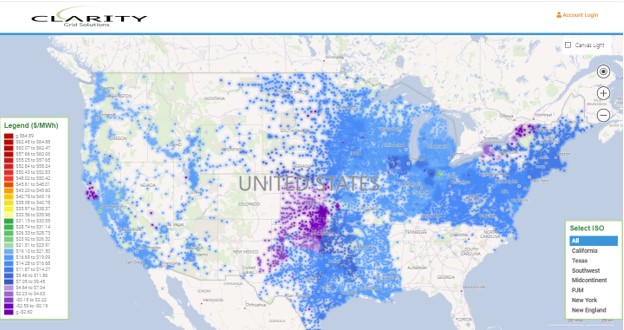
Clarity Grid sifts through the PNode and associated data output of the ISOs on a constant basis to interpret and add value to this data. Once filtered, Clarity provides a GIS picture of both the infrastructure and economics of the US Electric Grid in an easy-to-use UI or API format, essentially matching price with location. Once properly presented, developers on the Grid can identify promising new points for possible interconnection, as well as existing generation and storage facilities with important distinctions between renewable and traditional generation sources and capacities. Conversely, large manufacturers or Bitcoin miners can identify areas where wholesale power may be cheap due to large amounts of new solar or wind generation with limited transmission capability to move it to areas of population density. If initial reviews are promising, developers of both potential new generation or large consumers can also examine transmission line capacities, utility/transmission ownership of facilities and information about other large consumers or generators already in the area. All this information may also be filtered through a Node Library so that only the relevant data (e.g., all solar farms in ERCOT) is displayed.
Clarity PNode Additions
Even when distilled into discrete physical points for either generation or load, one must drill down further into the data to see real changes in the Grid. Nodal counts can grow for several reasons other than new construction. Many of the recent additions to Clarity’s nodal counts have been due to entire networks of certain utilities being added to either CAISO’s EIM or SPP’s WEIS markets. These expanded systems aim to reduce overall costs to consumers by optimizing the purchase of power across a larger set of generators within an expanded geographic territory. While these markets can be effective in reducing costs, their share of PNode count additions do not represent new infrastructure, but a re-categorization of existing assets. Likewise, ISOs do not assign PNodes to every substation (although typically they do to every generator). An ISO may deem only 2 out of 3 nearby substations as necessary to adequately provide price discovery for consumers. They also may later deem the third substation now important enough to assign its own PNode, and the notional count grows.
The distinction between newly added and truly new additions can be seen by comparing the 2 Charts below.
Chart 1
1Q 2023 Notional Node Additions
| NYISO | NEISO | PJM | MISO | SPP | ERCOT | CAISO | Total Fuel Type | |
| Solar | 2 | 0 | 9 | 0 | 0 | 9 | 49 | 69 |
| Hydro | 0 | 0 | 0 | 0 | 0 | 0 | 50 | 50 |
| Natural Gas | 0 | 0 | 0 | 9 | 6 | 2 | 39 | 56 |
| BM | 0 | 0 | 0 | 0 | 0 | 0 | 0 | 0 |
| Battery | 0 | 0 | 0 | 0 | 0 | 6 | 28 | 34 |
| Wind | 1 | 0 | 1 | 1 | 0 | 0 | 11 | 14 |
| Coal | 0 | 0 | 1 | 0 | 0 | 0 | 4 | 5 |
| Distillate | 0 | 0 | 6 | 0 | 0 | 0 | 0 | 6 |
| Geothermal | 0 | 0 | 0 | 0 | 0 | 0 | 0 | 0 |
| Total ISO | 3 | 0 | 17 | 10 | 6 | 17 | 181 | 234 |
| NYISO | NEISO | PJM | MISO | SPP | ERCOT | CAISO | Total Load | |
| Load | 0 | 1 | 105 | 66 | 26 | 311 | 568 | 1077 |
Chart 2
1Q 2023 Newly Constructed Node Additions
| NYISO | NEISO | PJM | MISO | SPP | ERCOT | CAISO | Total Fuel Type | |
| Solar | 2 | 0 | 4 | 0 | 0 | 6 | 5 | 17 |
| Hydro | 0 | 0 | 0 | 0 | 0 | 0 | 0 | 0 |
| Natural Gas | 0 | 0 | 0 | 0 | 0 | 1 | 0 | 1 |
| BM | 0 | 0 | 0 | 0 | 0 | 0 | 0 | 0 |
| Battery | 0 | 0 | 0 | 0 | 0 | 6 | 11 | 17 |
| Wind | 1 | 0 | 1 | 0 | 0 | 0 | 0 | 2 |
| Coal | 0 | 0 | 0 | 0 | 0 | 0 | 0 | 0 |
| Distillate | 0 | 0 | 0 | 0 | 0 | 0 | 0 | 0 |
| Geothermal | 0 | 0 | 0 | 0 | 0 | 0 | 0 | 0 |
| Total ISO | 3 | 0 | 5 | 0 | 0 | 13 | 16 | 37 |
| NYISO | NEISO | PJM | MISO | SPP | ERCOT | CAISO | Total Load | |
| Load | 175.8 | 0 | 31 | 5 | 1 | 71 | 5 | 113 |
As can be seen from a comparison of the 2 Charts, while notional additions grew by 1,241 (1,030 Load and 211 Gen) newly constructed nodal points only registered X. This was due to large nodal additions of previously constructed infrastructure, i.e., substations and generation, which represent the networks of newly added utilities in the CAISO EIM, specifically, BPA, City of Colorado Springs, CO, Arizona Public Service, amongst others. While the CAISO EIM system benefits through joint dispatch of the generation units of these newly added utilities in the real time market, they do not represent net additions to the generation stack of the US electric grid.
Newly Constructed Generation (Storage) by Fuel Type
Examining new actual net additions of generation to the 7 US ISOs in megawatts (mw) rather than nodal additions and separating them by fuel type gives a fuller picture of growth of renewables, storage, and other forms of generation over 1st Quarter of 2023.
Chart 3
1Q 2023 Newly Constructed Node Additions (mw)
| NYISO | NEISO | PJM | MISO | SPP | ERCOT | CAISO | Totals | |
| Solar | 40.0 | 0.00 | 76.00 | 0.00 | 0.00 | 1588.47 | 577.00 | 2281.47 |
| Hydro | 0.00 | 0.00 | 0.00 | 0.00 | 0.00 | 0.00 | 0.00 | 0.00 |
| Natural Gas | 0.00 | 0.00 | 0.00 | 0.00 | 0.00 | 183.00 | 0.00 | 183.00 |
| BM | 0.00 | 0.00 | 0.00 | 0.00 | 0.00 | 0.00 | 0.00 | 0.00 |
| Battery | 0.00 | 0.00 | 0.00 | 0.00 | 0.00 | 59.50 | 202.00 | 261.50 |
| Wind | 102.00 | 0.00 | 1100.00 | 0.00 | 0.00 | 0.00 | 0.00 | 1202.00 |
| Coal | 0.00 | 0.00 | 0.00 | 0.00 | 0.00 | 0.00 | 0.00 | 0.00 |
| Distillate | 0.00 | 0.00 | 0.00 | 0.00 | 0.00 | 0.00 | 0.00 | 0.00 |
| Geothermal | 0.00 | 0.00 | 0.00 | 0.00 | 0.00 | 0.00 | 0.00 | 0.00 |
| Generation | 142.00 | 0.00 | 1176.00 | 0.00 | 0.00 | 1771.47 | 577.00 | 3666.47 |
| Storage | 0.00 | 0.00 | 0.00 | 0.00 | 0.00 | 59.50 | 202.00 | 261.50 |
Once again ERCOT dominates the list of newly constructed generation and storage, with growth in solar units particularly noteworthy at over 1.5 gws. CAISO did register over 500 mws of solar itself and over 200 mws of storage over the quarter. The largest single addition to the generation stack is somewhat misleading. PJM registered a PNode for Ocean Wind PECKBAY 138 KV OCW01, a 1,100-wind development off the coast of southern New Jersey which is not slated to come online until late 2024. However, in keeping with our methodology of adding units once the PNode is published it forms the largest single addition to Chart 3.
Noteworthy Examples of Generation Additions:
NYISO
NYISO is unique in remaining a Zonal Market for Load, meaning that PNodes for individual load points (substations) are not published, only the Zonal price for 11 individual geographic regions is published. However, a PNode and corresponding price for each set of generation units is published in keeping with the convention of all other ISOs. During the 1st Quarter of 2023 saw three new generation projects come online from a PNode perspective, Eight Point Wind, Grissom Solar, and Janis Solar, or 142 mw of nameplate capacity. Eight Point Wind, NextEra’s 102 mw wind farm is shown below:

PJM
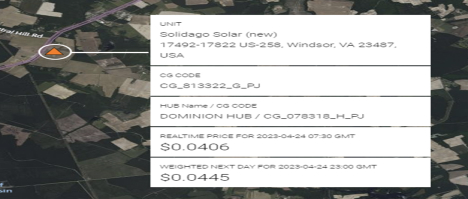
Within the set of Middle Atlantic and Midwestern States which comprise PJM there have been noteworthy solar additions in New Jersey and Virginia over the last few quarters. This remained the case as PJM added 76 mw of solar generation over the Quarter. A screenshot of Dominion Energy’s 20 mw Solidago Solar in Windsor VA is shown below, one of 4 new solar farms added in PJM over the Quarter.
CAISO
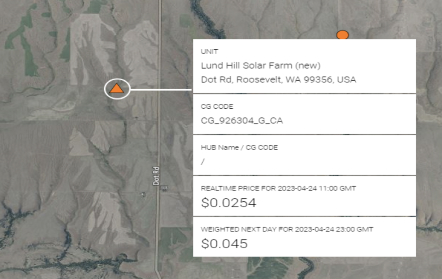
As seen from Chart 3 CAISO saw 577 mw of solar generation added to the ISO over the 1st Quarter. This was due to 5 solar farms (only 1 in the State of California), the rest in the CAISO EIM market spanning the US West coming online, again from a PNode perspective. Below is a screenshot of Avangrid’s Lund Hill Solar Farm, 150 mw in central Washington State:
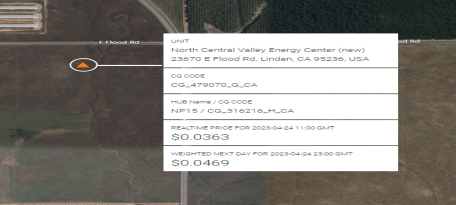
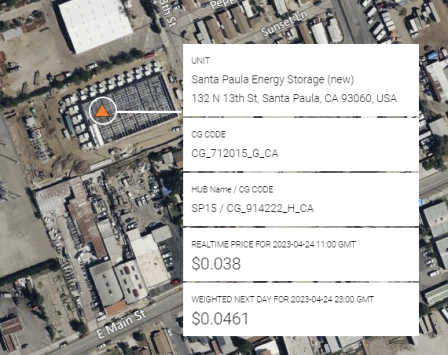
Below is a screenshot of NextEra’s 132 mw Solar Farm being constructed and receiving PNode status for the facility in Linden, CA:
Despite much enthusiasm for grid-based battery additions across the US, only CAISO and ERCOT added to their already dominant position in ESR growth over the Quarter. Below is screenshot of Santa Paula Energy Storage’s new facility (also referred to as Black Walnut Energy Storage), a 30 mw, 60 mwhr battery installation constructed and operated by EsVolta, in Santa Paula, CA.
ERCOT
Because of its significant additions to generation, storage, and load infrastructure, a Blog piece devoted only to ERCOT could be published. This is particularly true when additions in ERCOT are compared to the relatively meager pace of additions to the other ISOs. More specifically, ERCOT saw additions of solar capacity of 1,588 mws and almost 60 mw of storage added during the period. Solar additions were accounted for by 6 projects Andromeda, Estonian and Texas Nova, Spanish Crown, Golinda, and Jade. A screenshot of Clearway Energy’s 450 mw Texas Nova project is shown below:
![]()
Gross additions to ERCOT storage capacity were principally due to the inclusion of 4 HEN Infrastructure 9.95mw/mwhr projects which were awarded PNodes during the period, one example, Val Verde BESS in Donna, TX is shown below sited next to the STEC’s 138kv Val Verde substation.

Noteworthy Examples of Load Additions:
While the industry’s focus has principally been on additions to generation (and increasingly storage), the introduction of new load points (substations) has been of rising interest due to the need for smaller projects to interconnect to the grid. Even here it is important to distinguish between transmission, distribution, or customer-owned substation capacities. The interconnection process can be quite different depending upon line capacities distinguishing transmission from distribution voltage. Also, typically customer owned substations are not candidates for third party interconnection. Clarity’s database and UI views are populated with line capacities and identification of large load names as part of its metadata library. That said, indications of new large loads coming onto the grid such as data centers or manufacturing facilities can be of interest to a broad set of industries, not just the power development sector. The following are some noteworthy examples of new substation capacities of interest by ISO:
PJM
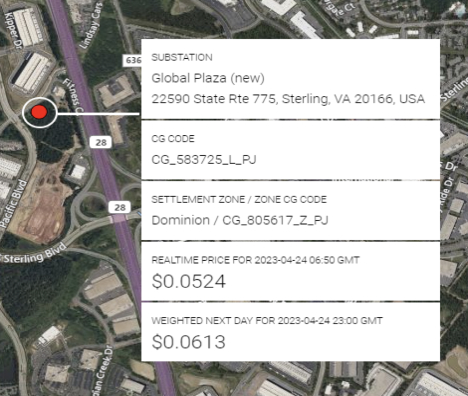
Below is a screenshot of such a large new data center load in Virginia, QTS Ashburn-Broderick Data Center in Dominion Energy’s territory of Sterling, VA:
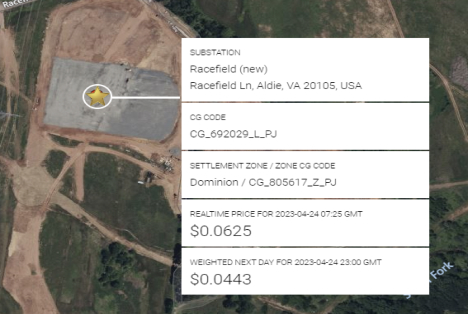
Staying in Dominion territory but on the transmission level, below is screenshot of Dominion’s new Racefield 230kv substation in Alde, VA now under construction:
MISO
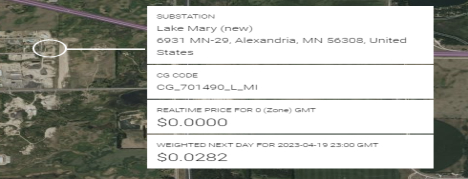
MISO registered only 4 newly constructed substations over the quarter, an example of which is Great River Energy’s 115 kv Lake Mary substation constructed in Alexandria, MN:
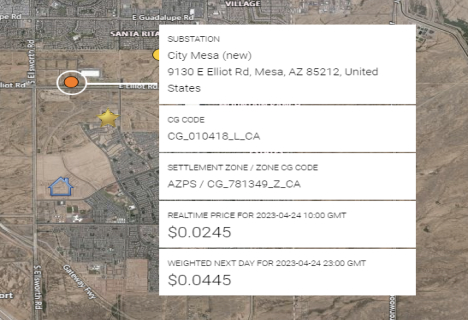
CAISO
There were no new additions to substation capacity in the state of California, and only a few in CAISO EIM over the period. One such example is the set of City of Mesa, AZ substations in APS territory being constructed to serve the new Mesa Elliot Mesa Technology Park, 69 kv:
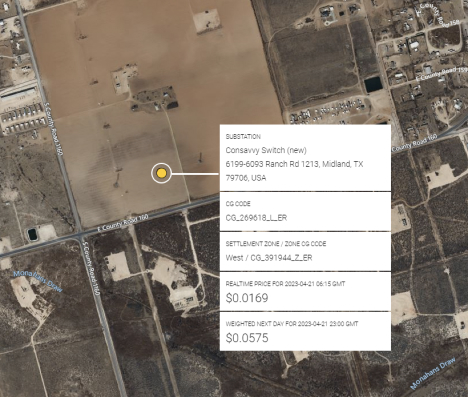
ERCOT
As seen with the growth in both generation and storage, ERCOT saw significant construction activity as dictated by PNode introductions on both the customer owned and transmission/distribution level. Below is a screenshot for Oncor’s new Consavvy Switch Substation 345/138kv in Midland, TX which is connected to transmission and surrounded by E&P production:
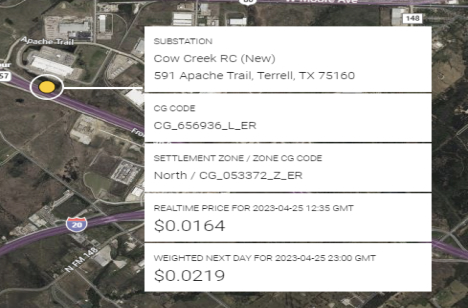
In terms of construction to serve dedicated load, see below Brazos Electric Coop’s 138kv substation built to serve Walmart Distribution Center load in Terrell, TX:
If you are interested in viewing all existing and new load and gen facilities, please inquire about a trial at https://www.claritygrid.net and select “Request a Demo.”