Battery Installation Growth Projections
One of the most significant trends in the evolution of electric grids throughout the world of late has been the rapid deployment of energy storage using advancing battery technology improvements. With the prices for Utility scale battery projects forecast to fall to $100/kWh by 2023 from the mid $100s today, large scale battery deployments are expected to grow from 2.12 GW in 2020 to 190 GW in 2050 [1]While less transparent, the deployment of energy storage (battery) on a residential, commercial, or industrial customer premise behind the meter (BTM) is at least equally significant as a factor driving battery adoption across the Grid. During the same 2020 to 2050 time period BTM storage in the US is expected to grow from .8 GW to between 85 and 245 GW under various market and economic scenarios according to National Renewable Energy Laboratory (NREL)[2]. To put this into perspective the installed generation base for the entire US Grid in 2021 was almost 1,200 GW. The projected growth in battery installations is even more significant when considering overall electric consumption has been flat over recent years and is projected to grow only a low single-digit percentage over the same 2050 timeframe. Factors driving these projections for battery installations other than declining costs include compatibility with solar installations, the interruptible nature of renewable generation, and the expected dramatic increase in electric vehicle (EV) adoption.
Battery Value Assessment Grid-scale battery installations have traditionally been co-located with new or existing renewable generation projects, although the Grid has seen an influx of merchant battery projects recently. The driving factor of in front of the meter battery addition to existing generation has been to increase the capacity factor of a given wind or solar project, the sun doesn’t always shine, and the wind doesn’t always blow. In contrast, behind the meter battery installations often must take into consideration the structure of the distribution utility service cost schedule (tariff). This is true because most entities with loads large enough to consider battery storage most likely face specific charges for their maximum usage measured over a short period of time (15-60 minutes) within a given month or series of months (demand charges). Demand charges can often make up the largest share of the customer’s overall electric bill (30-60%). Even standalone batteries (not paired with solar or other generation sources) can make economic sense when customers’ alternatives are large demand charges. By shifting periods of consumption and thereby “flattening” the load profile demand charges can be reduced, or in some cases eliminated. Also, to the extent that the customer has an option to adopt a time of use (TOU) tariff in which either distribution, energy, and or demand charges vary by the hour of the day, the customer’s utility bill can be reduced even further if usage and or demand shifts to “cheaper” hours as the result of the use of a battery. When paired with solar or other DERs, a battery can allow a customer to realize the value in markets that do not offer net metering, realize greater value than net metering may offer from excess solar generation. Lastly, proposed regulatory changes such as FERC Orders 841 and 2222 will require ISO market operators to allow batteries to participate in other markets for ancillary services as though they were large generators. This would be true for batteries operating either in front of or behind the meter.
[1] https://www.nrel.gov/news/program/2021/grid-scale-storage-us-storage-capacity-could-grow-five-fold-by-2050.html
[2] https://www.nrel.gov/docs/fy21osti/79790.pdf
In addition to the tariff structure described above, a second key consideration in potential battery savings is the nature of the customers energy consumption on a 15 minute or hourly basis across the year. The nature of the customer’s “load profile” is a key factor in identifying utility bill savings from modifying the load with a battery. In other words, if the customer’s load is constant across hours, installing a battery to shift loads from one hour to the next will have little effect on their overall bill in the absence of TOU billing. For example, industrial loads which are “peaky” or vary significantly by hour would benefit from shifting some of this load to other hours where consumption is low. As a general rule of thumb, the size of the proposed battery installation must be less than the difference between average usage during peak vs non-peak hours to generate any savings from traditional monthly demand charges.
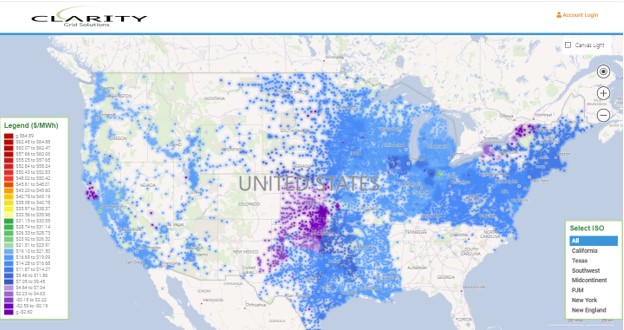
Clarity Battery Analytics
Clarity has developed a BTM Battery Saving Calculator which draws upon both our comprehensive nodal locational and pricing database for over 70,000 nodal points as well as a national tariff library housing almost 9,000 tariffs for over 1,800 Distribution Utilities. The last necessary database element: hourly load estimation, is provided as either an upload of actual usage read from a smart meter, or an estimate using the closest of 136 NREL cities’ residential or commercial building profiles. After entering the address of the location to be analyzed and selecting the relevant tariff, a Battery Savings calculation is run from either actual or simulated usage. The algorithm embedded in the calculator will read hourly load across the series of months in the profile and select first the two hours within a day the customer’s load most often “peaks”. Next, the algorithm will then identify the two hours daily that the real-time nodal or settlement price appropriate for the customer’s location is most frequently the lowest. Lastly, the algorithm will then identify the largest peak in load during the entire time frame analyzed and size the battery at the next lowest kW increment for a 2-hour kW battery as read from Clarity’s extensive kW size/duration and price matrix. The output of the algorithm is simply a modified load profile for the entire period subject to the considerations listed above. After running one “Opportunity Analysis” using the default of a 2-hour battery appropriately sized, the User may then access the full Battery Pricing Matrix to select alternative durations and sizes.
Battery Analytics Use Case: United Illuminating GST w Demand
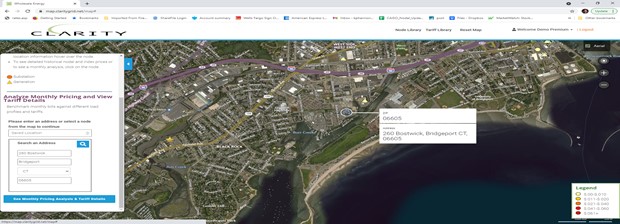
As a simulation first an address is chosen for analysis, in this case, O&G Bridgeport Asphalt in Bridgeport, CT.
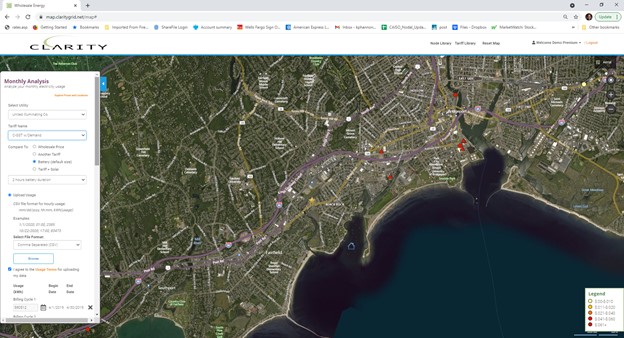
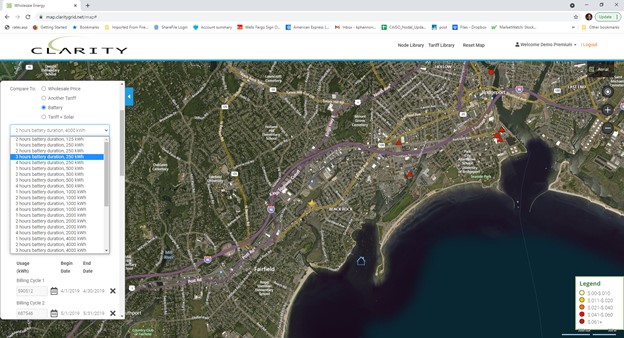
Displayed below is the view after the appropriate Tariff, “Compare to” screen, and Upload Usage file has been selected, notice that 2 hours battery duration is preselected at this point:
After “See Opportunity Details” is selected the following Chart displaying before and after savings for Battery is displayed in Total and by Cost Category:

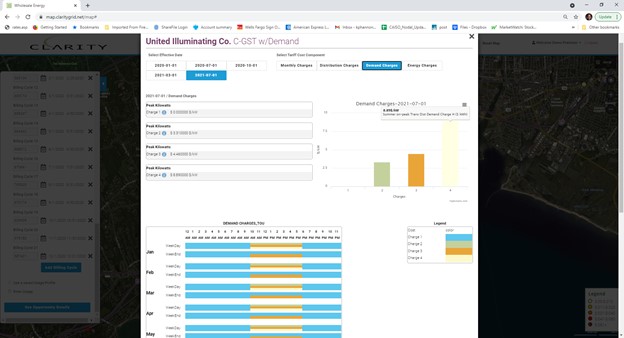
As can be seen from the line-item descriptions, the greatest savings are derived from reduced demand charges. This can also be seen graphically when selecting “Detailed Tariff View” where the TOU Chart shows that Demand Charges 2-4 are only effective from 10 am to 6 pm daily.
Lastly by selecting “Chart Hourly Data” from located on the lower left side of the Opportunity Chart the User can see both the before and after patterns of usage:
As mentioned after the first simulation, the User can then run any number of other simulations using alternative durations/kw size combinations:
In this way, almost any combination of tariffs, loads, and battery duration/size combinations may be run for potential savings opportunities.