First Half of 2021 Nodal Updates
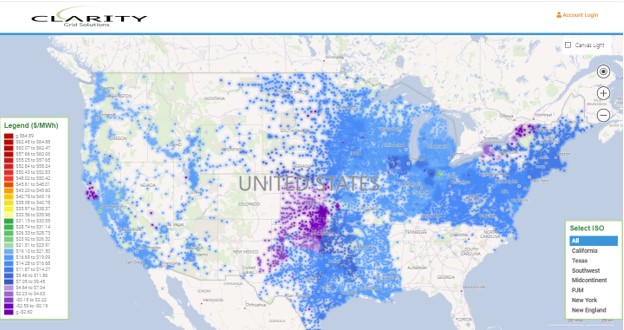
For years economists and other market researchers, suspicious of official government statistics, have watched Chinese electric consumption figures to more accurately gauge economic growth. The thinking being that such figures as power consumption by industry sector or city was a more reliable indicator of what was happening in the “real economy” than any Chinese estimate of GDP. In a similar way, each of the seven organizations charged with operating the power grid in various parts of the US provide the market with a continuous update on where power generation and consumption is changing. While real time power flow data is usually not available publicly, load growth and reductions can be inferred by the updates to the topography of the electric grid through the addition or subtraction of price nodes. Each node represents a geographic location for power generation or delivery across the wholesale market.
Clarity has just completed its update of new price node locations and associated metadata as of late April of 2021 with the following results of note:
In total there were 3,770 node additions to the platform, 3,201 Load and 569 Gen. Particularly in the case of Load, these additions frequently were incremental capacity being added to existing substation locations. Also, in the case of CAISO much of the additional node counts were due to the expansion of the CAISO Energy Imbalance Market (EIM) through the addition of new Load Balancing Agencies (LBAs), more on this below.
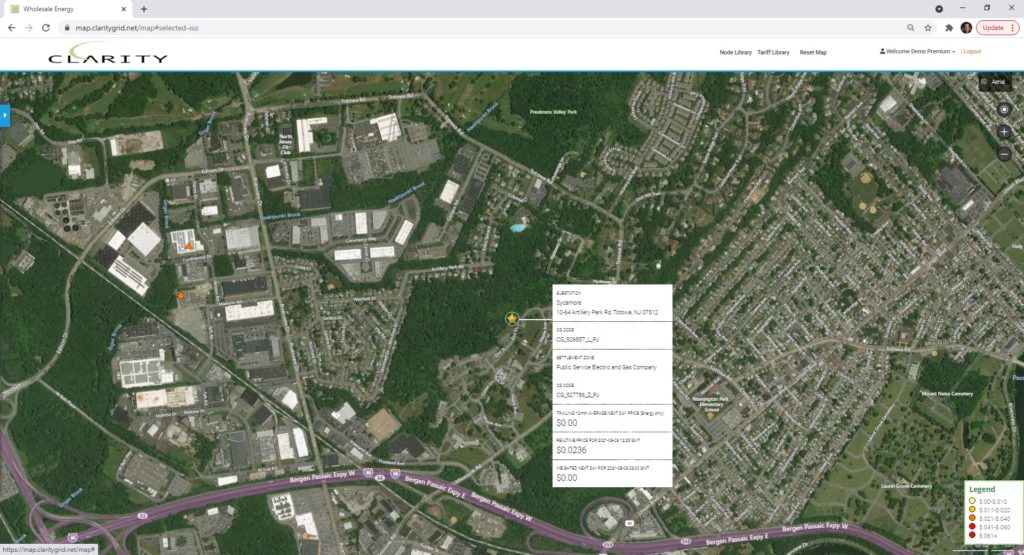
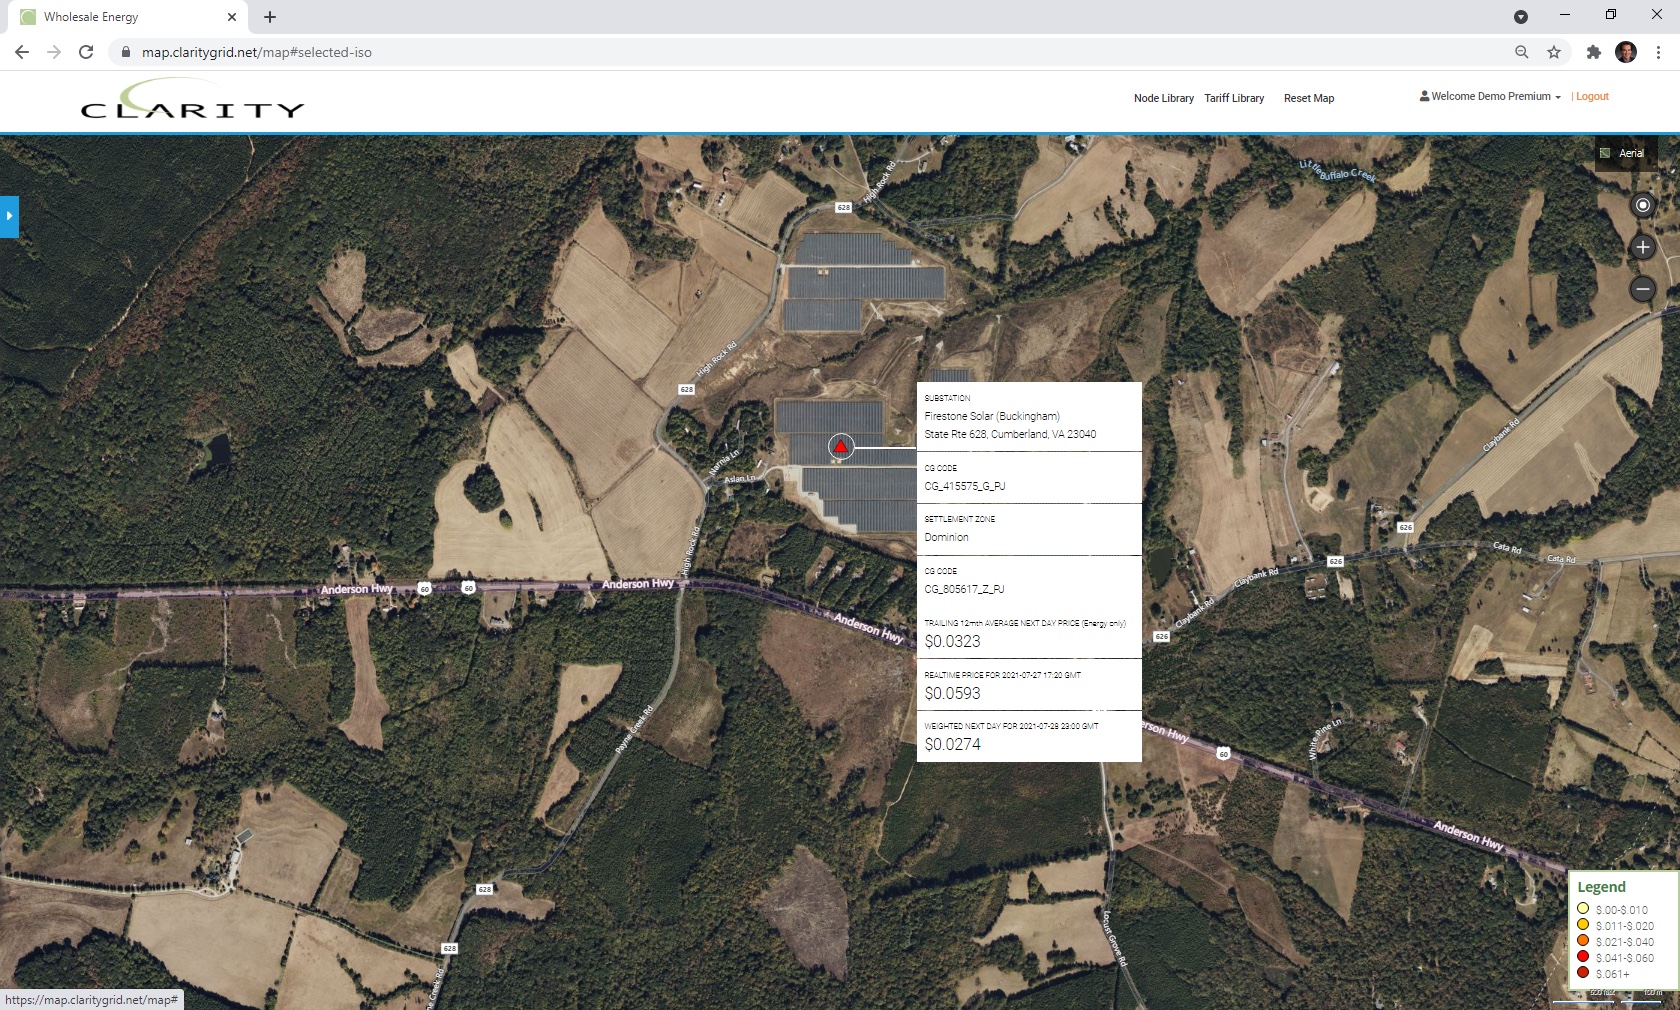
PJM: Load Node additions were 992 and Generation 72 with several new substations, notably PSEG, Ohio Power (AEP), and PPL, coming online throughout the Region and Solar facilities in PSEG and Dominion VA and NC territories becoming operational.
New PSEG Sycamore 69 kV Substation, documents show JP Morgan as owner of Datacenter, viewable on Google Maps:
Buckingham Solar 2 (Amazon East), new 20 mw Solar Farm with Amazon offtake:
MISO: Load Node additions were 603 and Generation 61 with new load additions at industrial, ethanol, and pipeline facilities. New generation was largely wind facilities particularly in MN and the Dakotas.
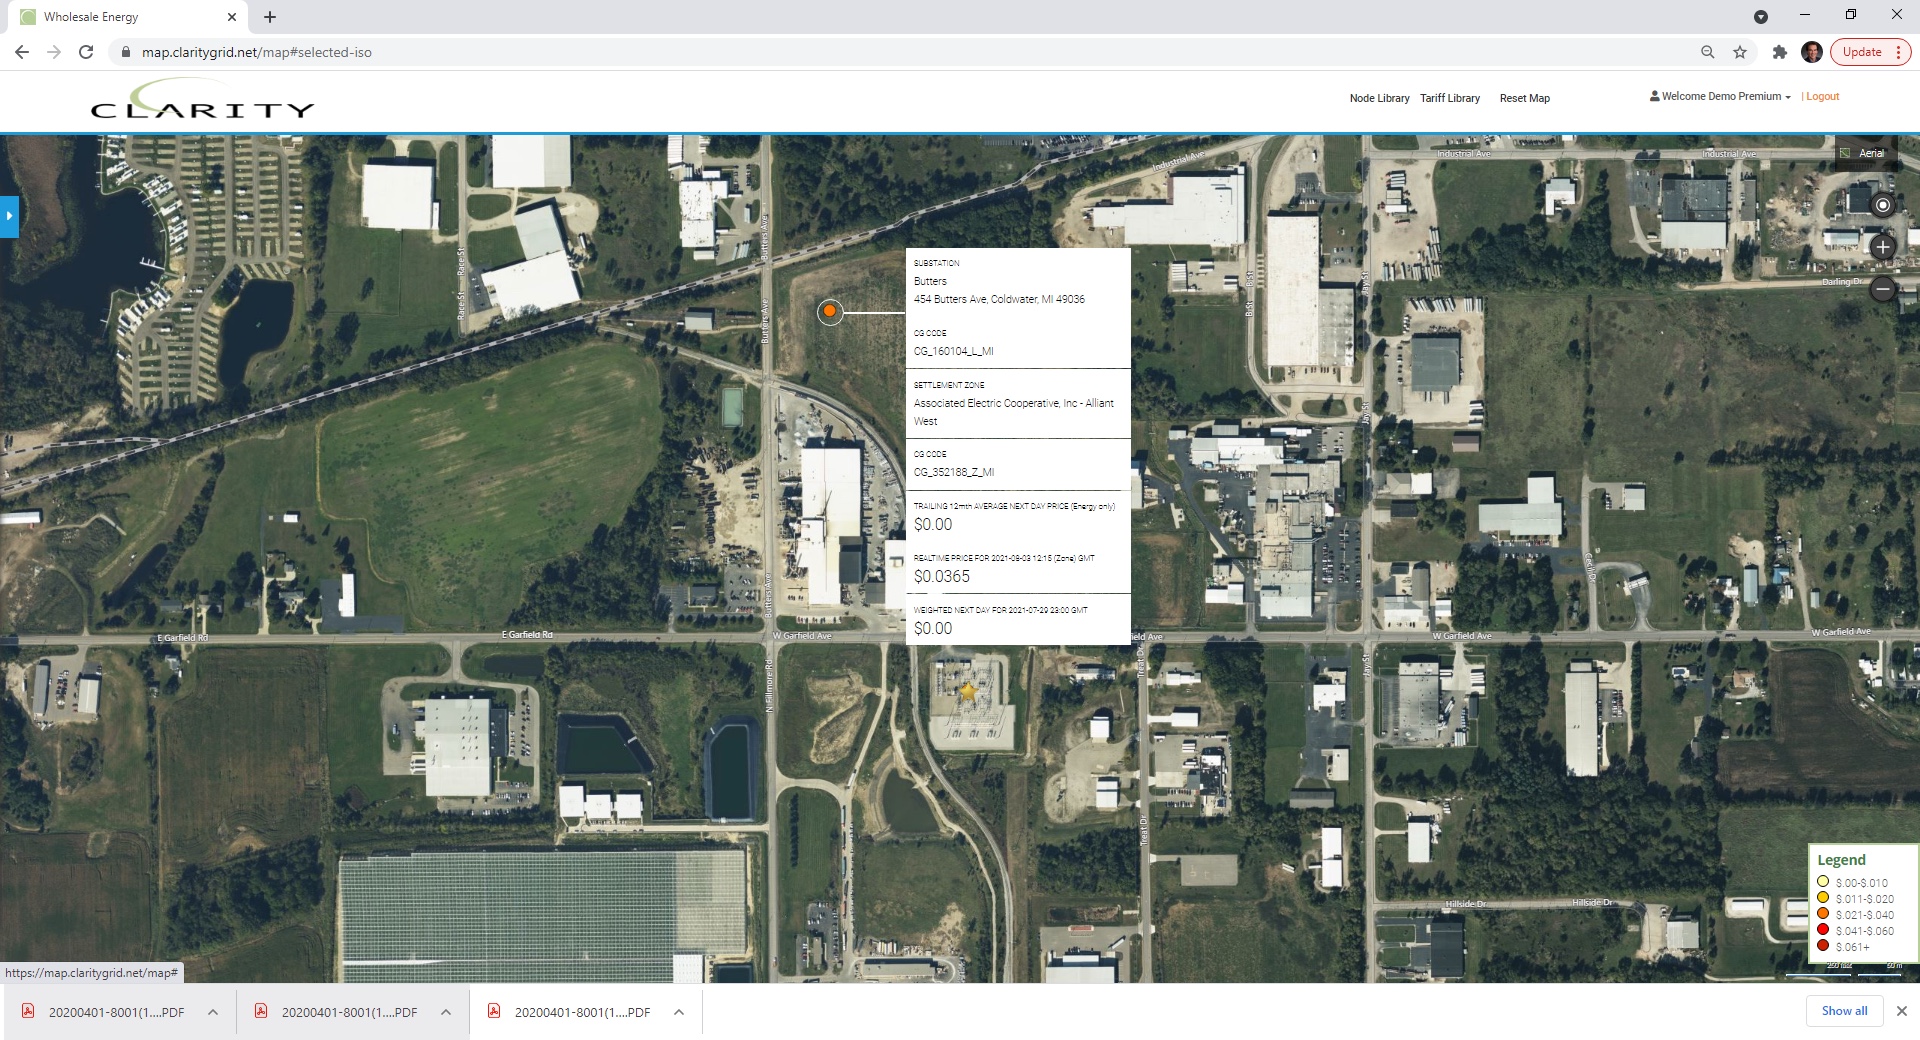
Consumers Energy new Butters 138 kV Substation serving industrial load growth in Coldwater, MI
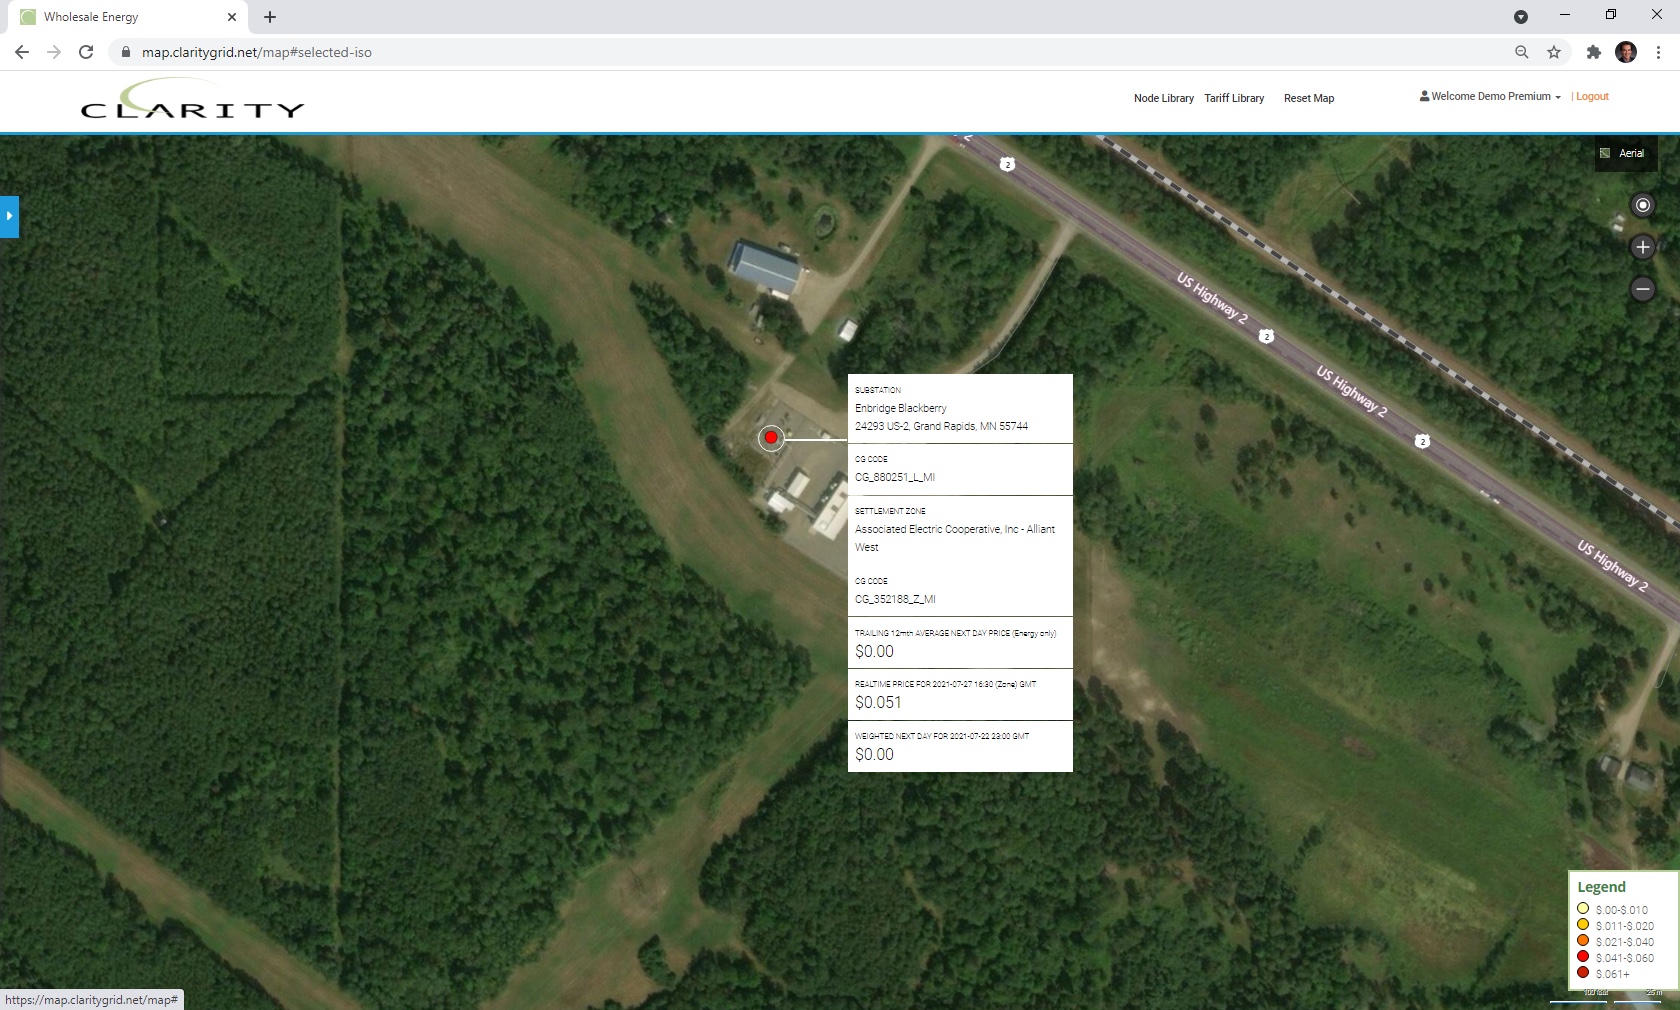
GRE Blackberry 115 kV substation serving Enbridge pipeline facility.
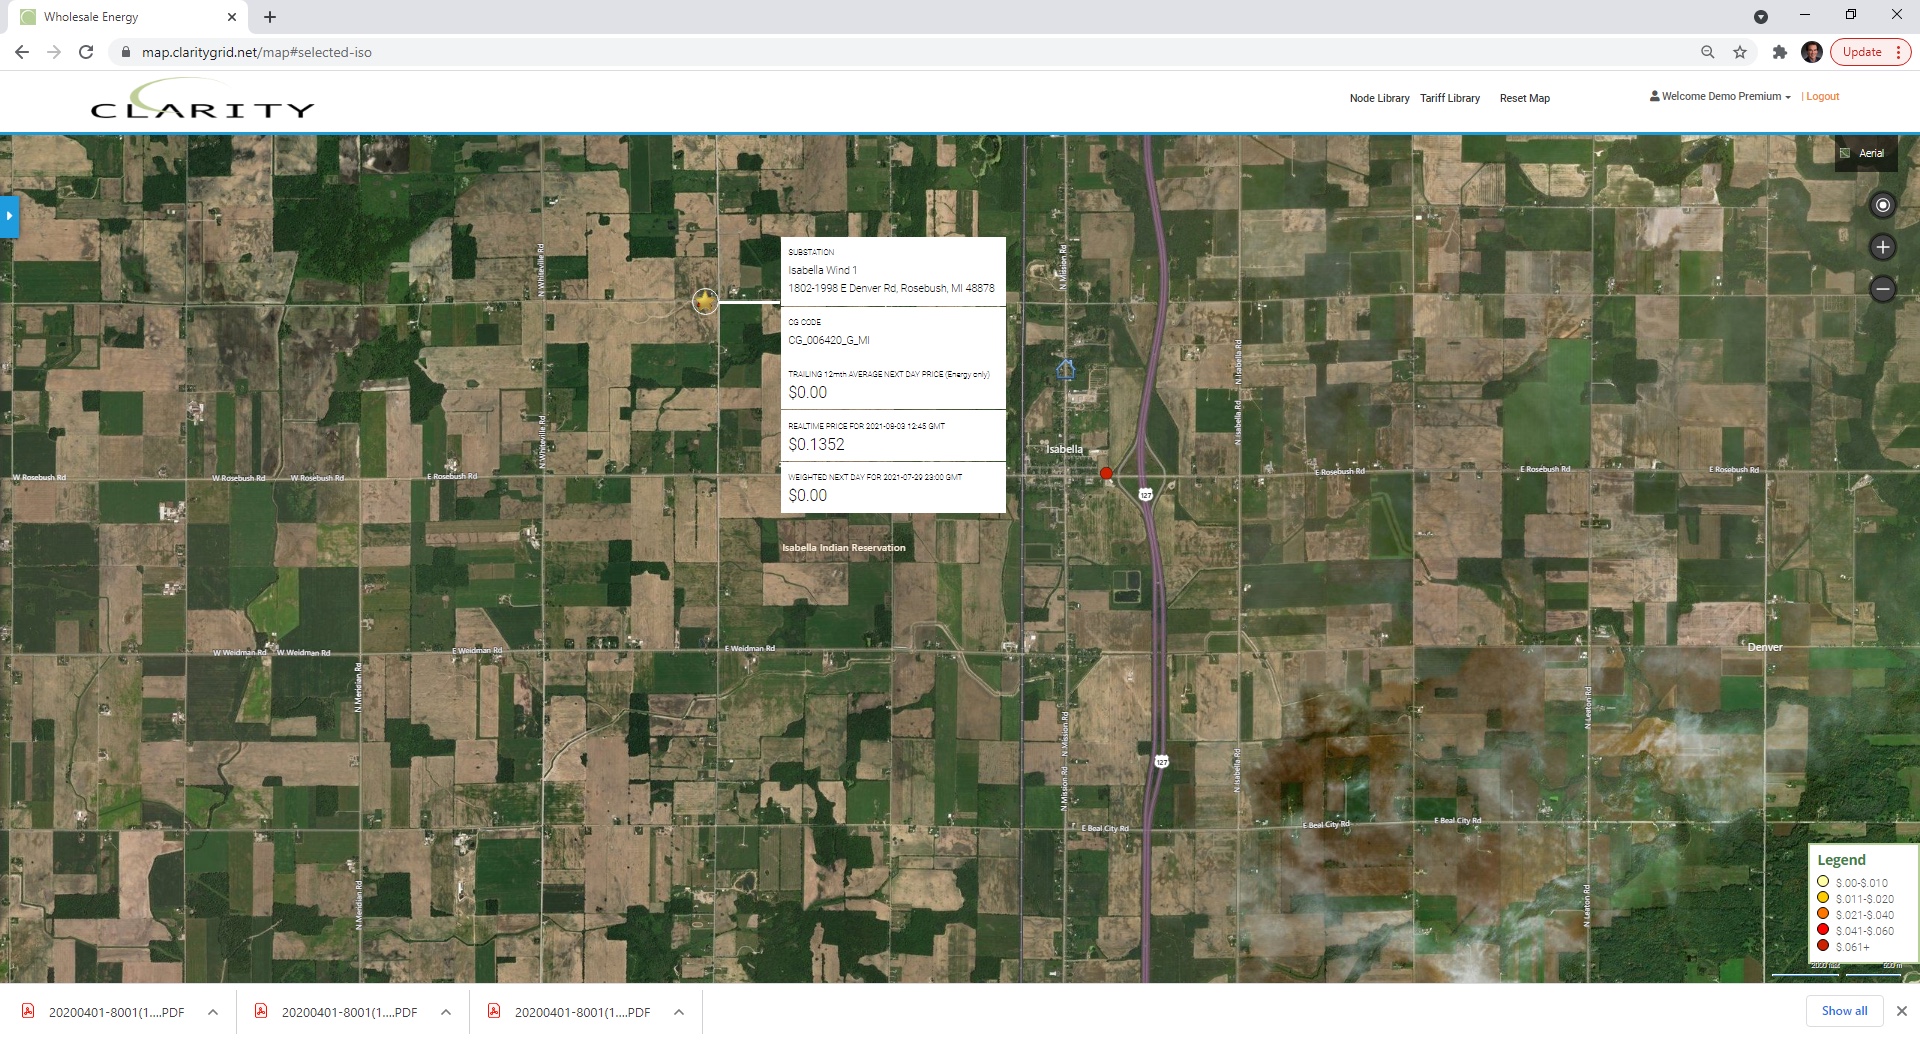
In Consumers Energy MI territory Apex Clean Energy’s Isabella, I and II 383 mw Wind farm appears just northwest of Isabella, MI
In SPP there were 82 Load nodes and 58 Generation nodes in 2Q 2021, including Load nodes to support new pipeline facilities and continued growth in Wind Generation.
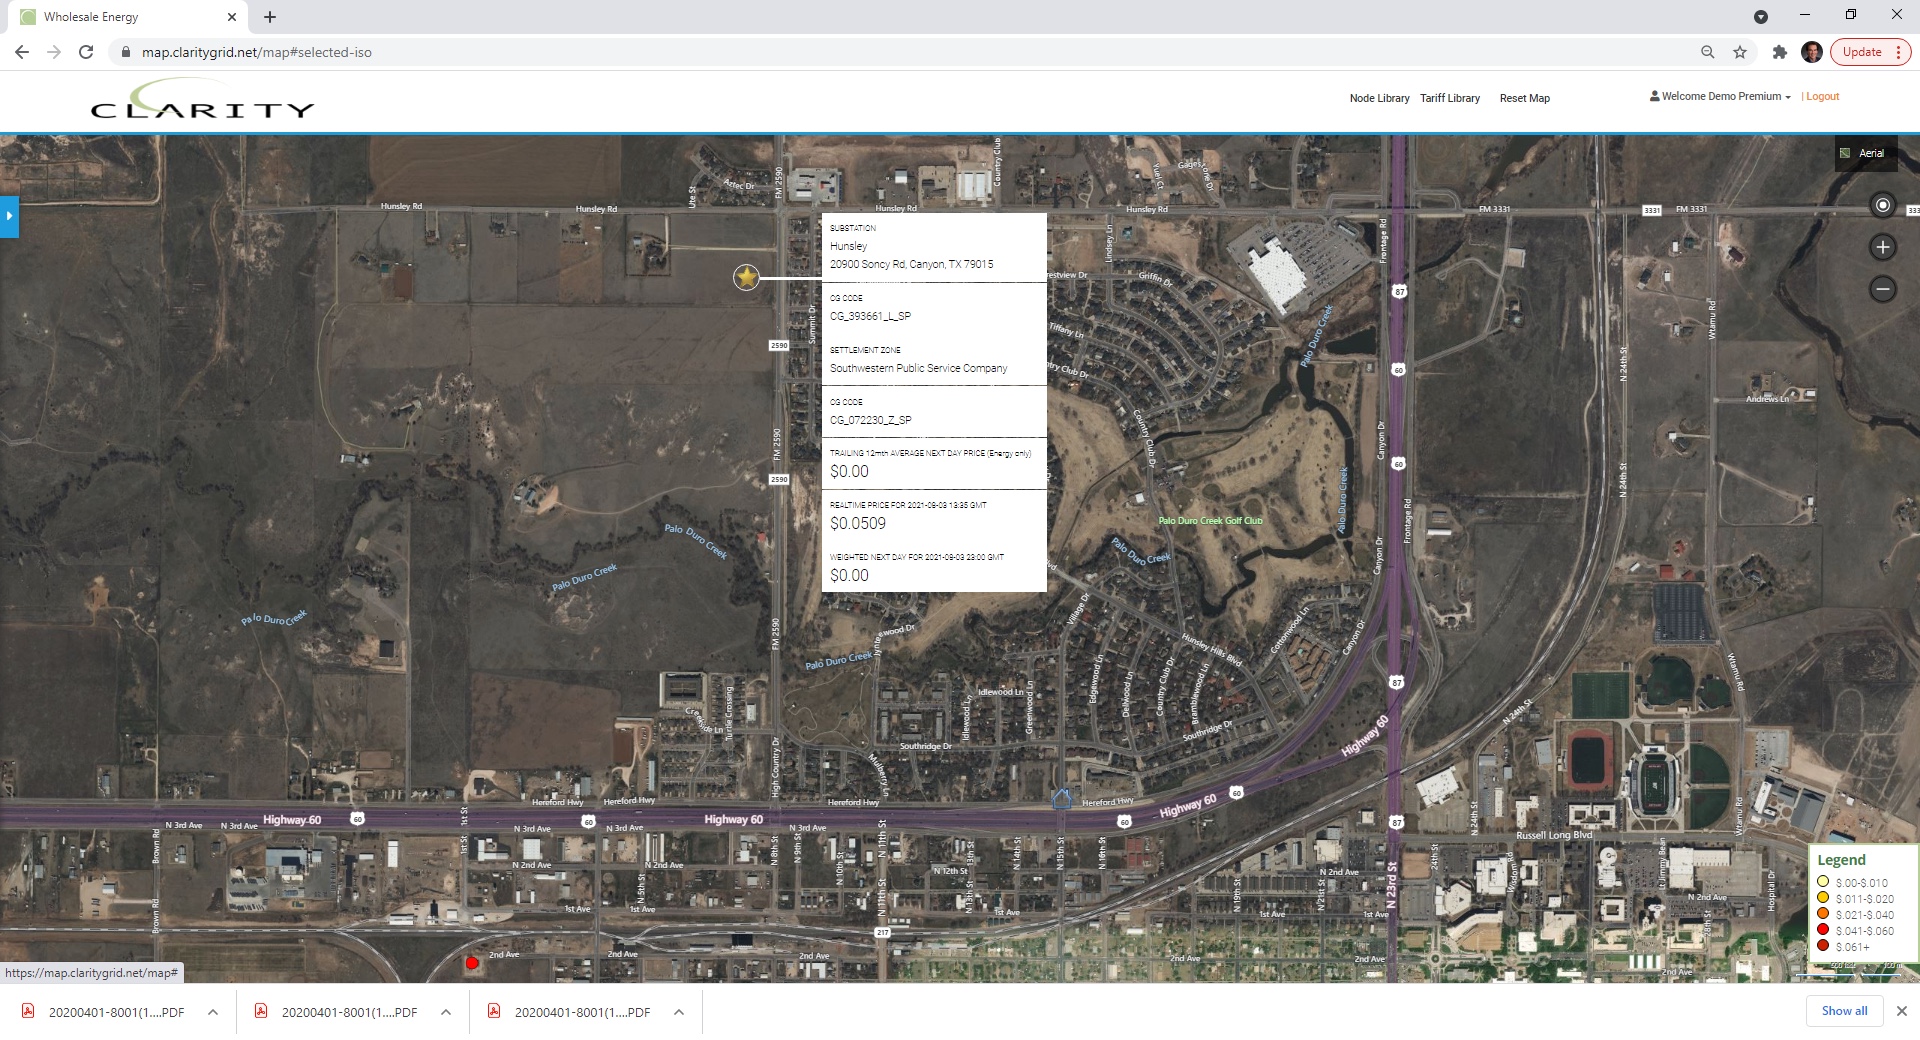
In SPS territory new Hunsdale 115 kV Substation is introduced to support load growth in the Amarillo, TX area:
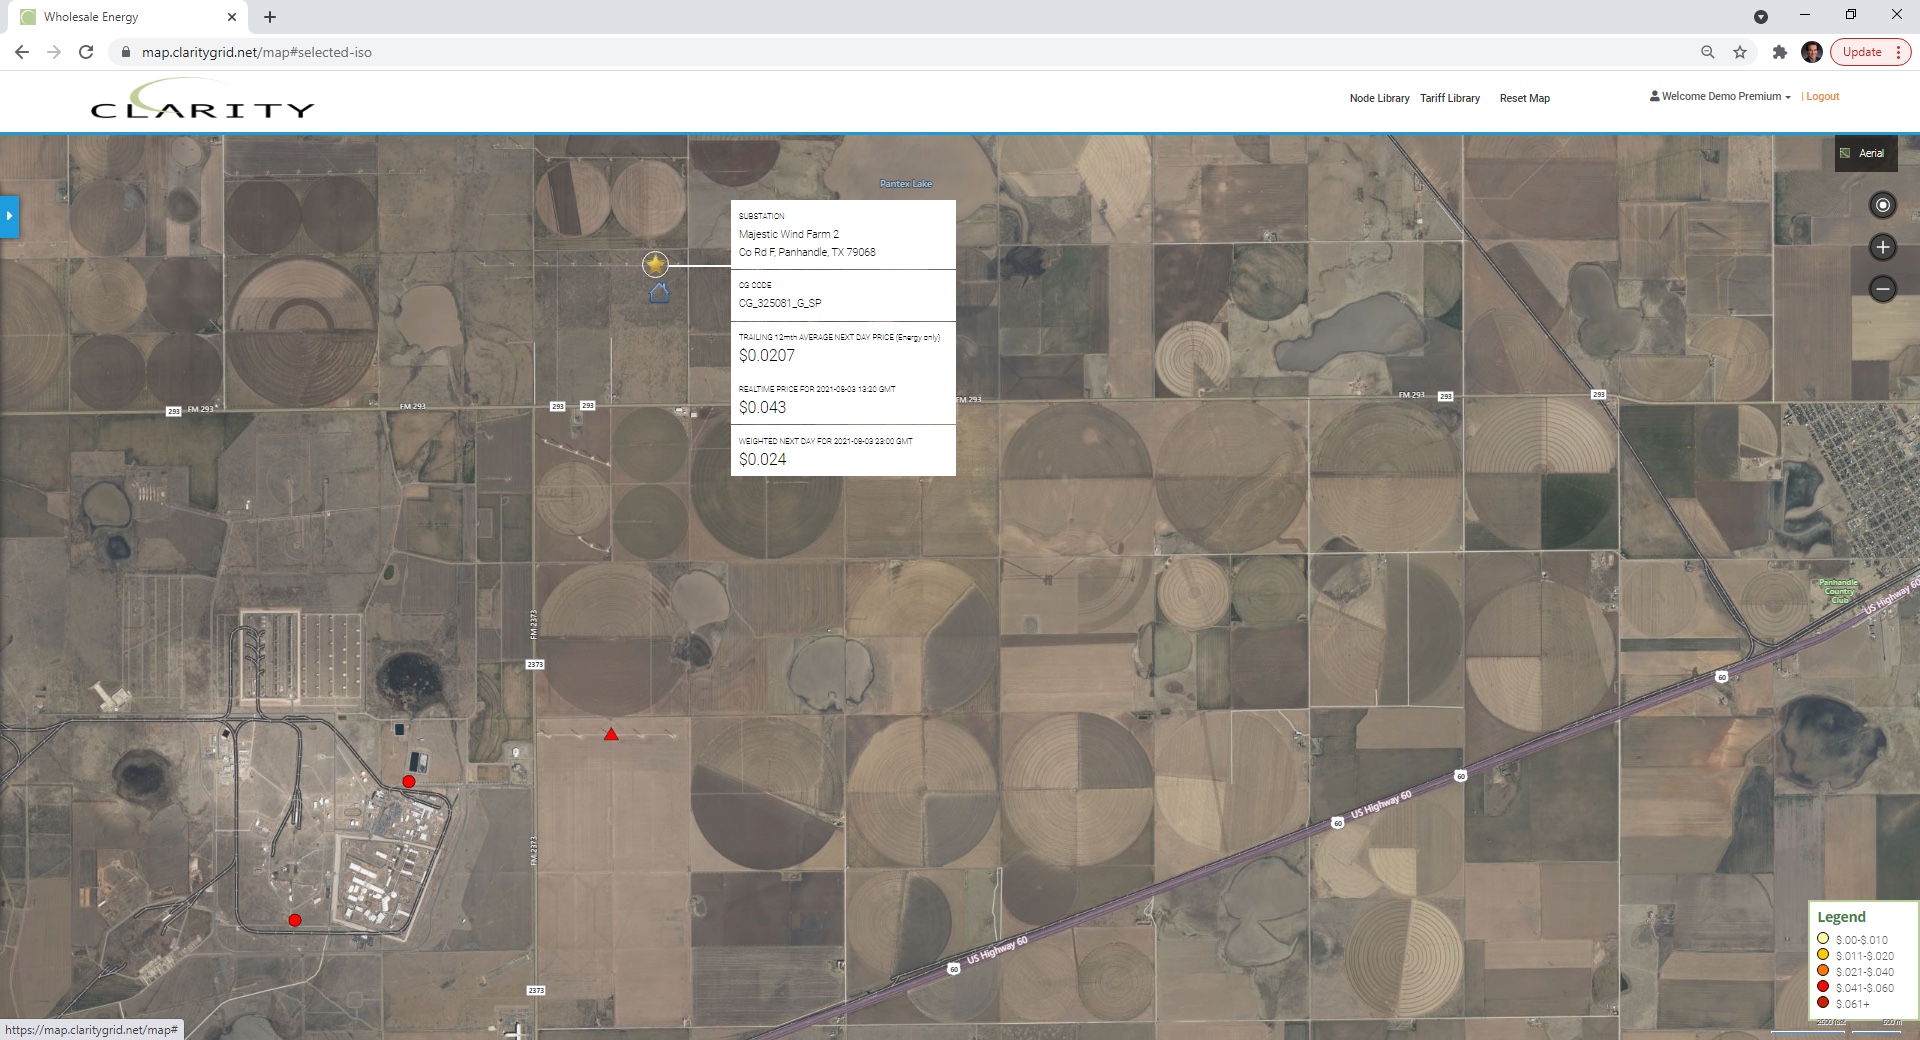
SPS NextEra Majestic Wind Farm 2 32 mw facility appears near Abell, TX
During 2Q ERCOT added 732 Load Nodes, many to feed strong industrial growth, and 74 Generation nodes (Battery included in this category):
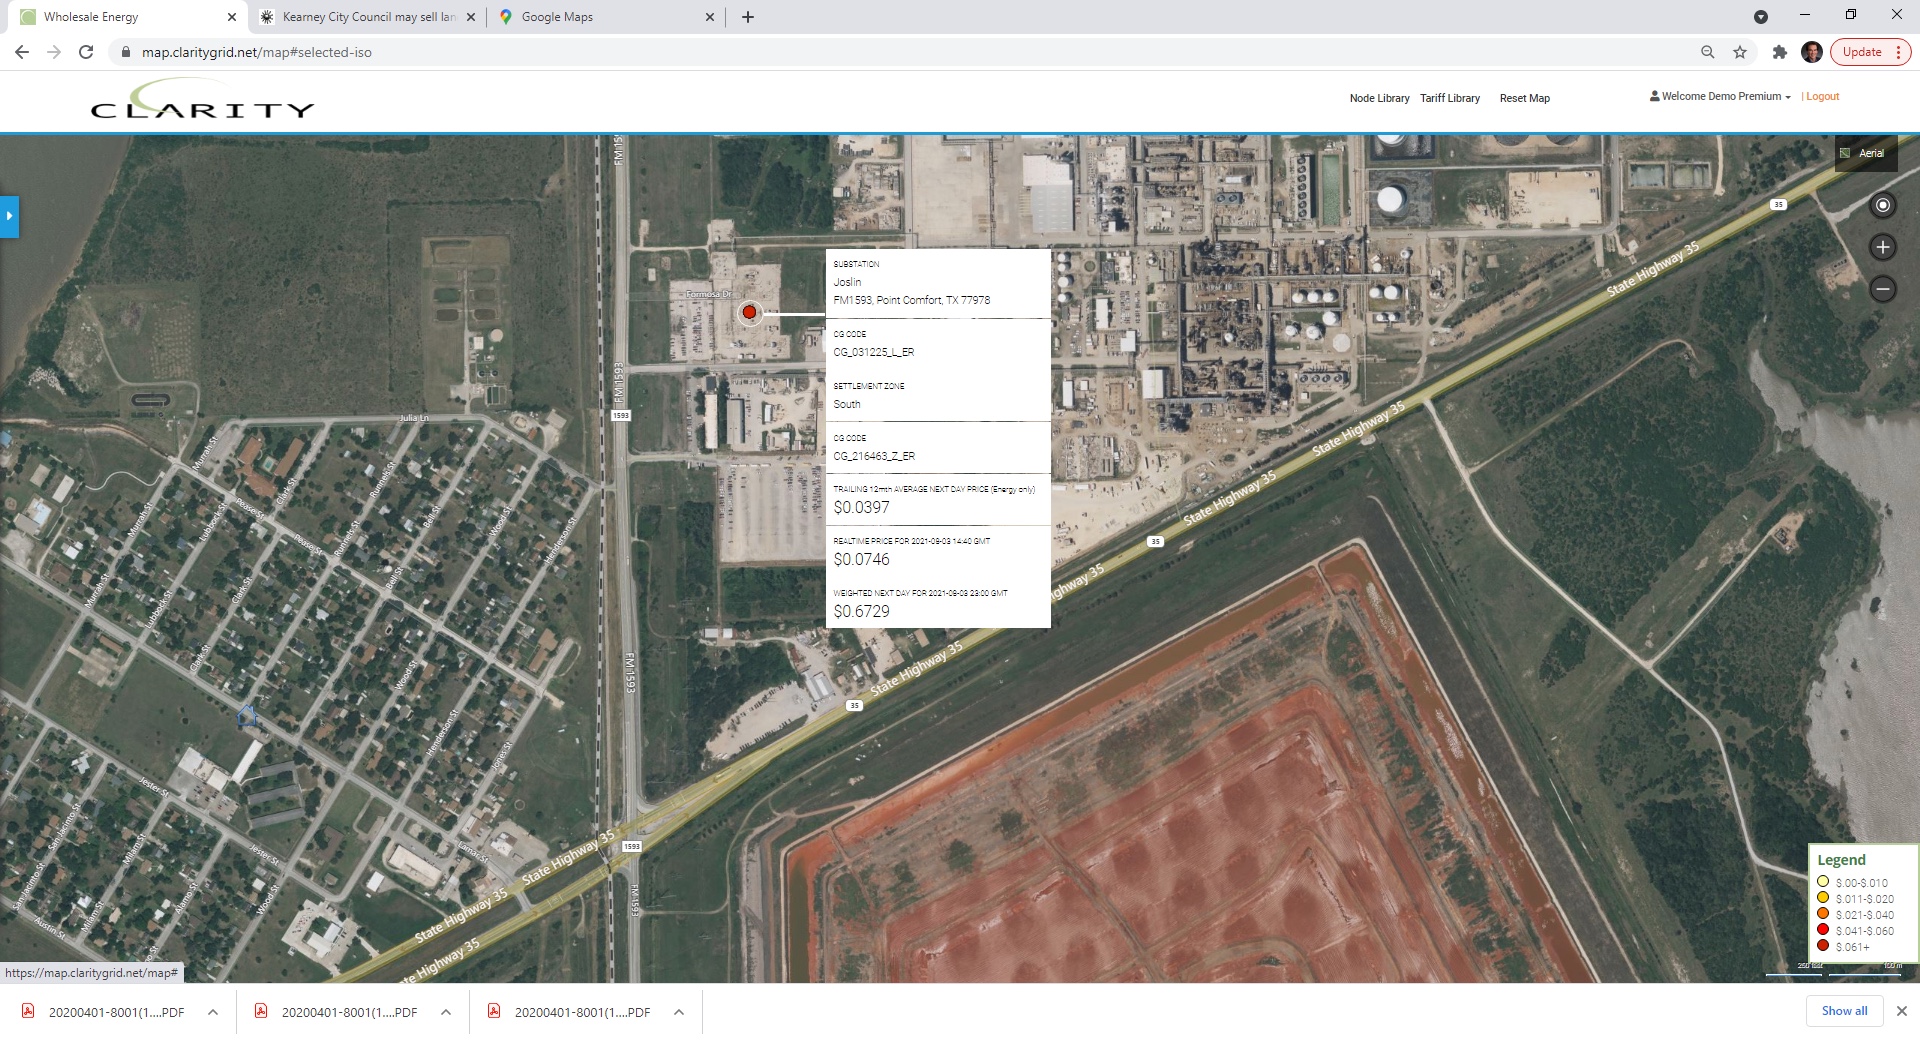
Centerpoint’s Joslin 138 kV substation added to support Formosa Plastics load growth in Port Comfort:
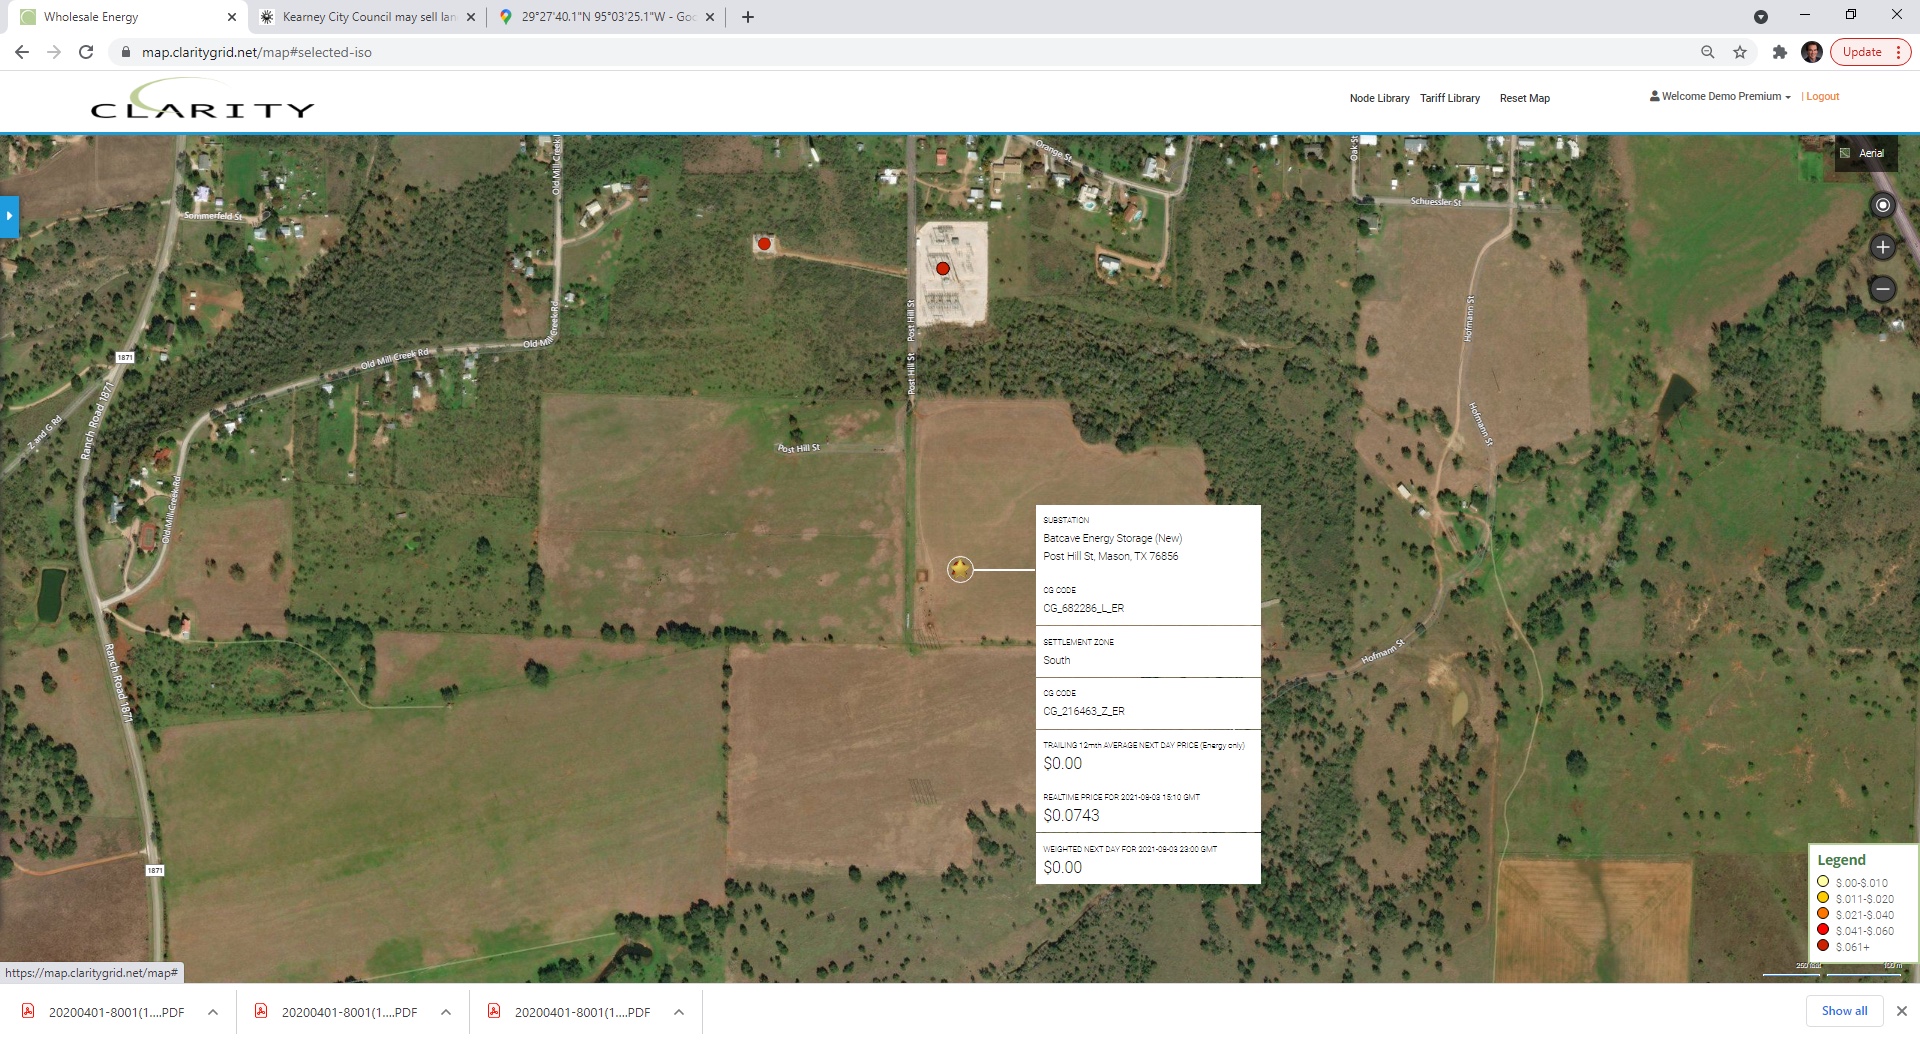
Broadreach Power’s 100 mw Batcave Energy Storage Project introduced onto grid adjacent to Oncor’s Fort Mason 138 kV substation.
CAISO saw most of its growth in both Load and Gen nodes due principally to the addition of Public Service of New Mexico (PNM) to CAISO as an Energy Imbalance Market (EIM) member Utility. In addition, LADWP and Turlock Irrigation District were both broken out as separate Load Balancing Authorities (LBAs).
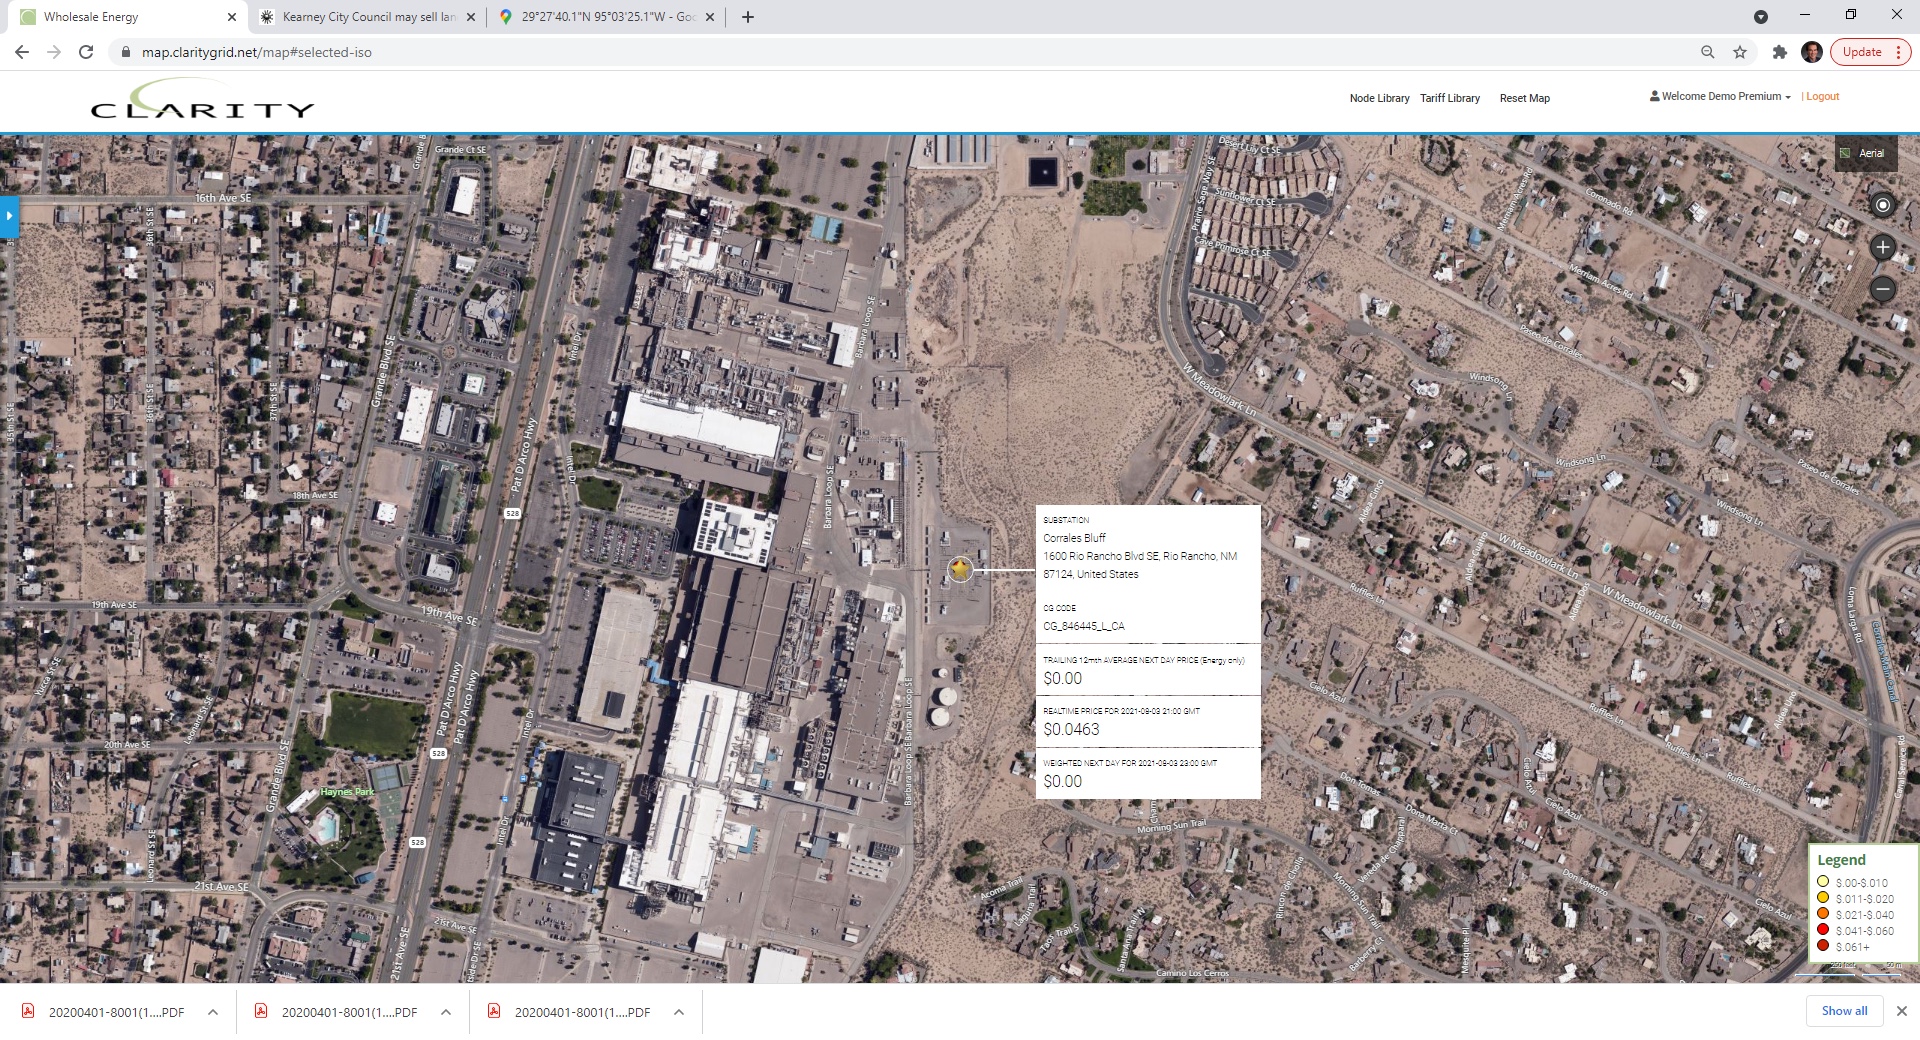
PNM Substations added through CAISO EIM market providing pricing transparency to new market:
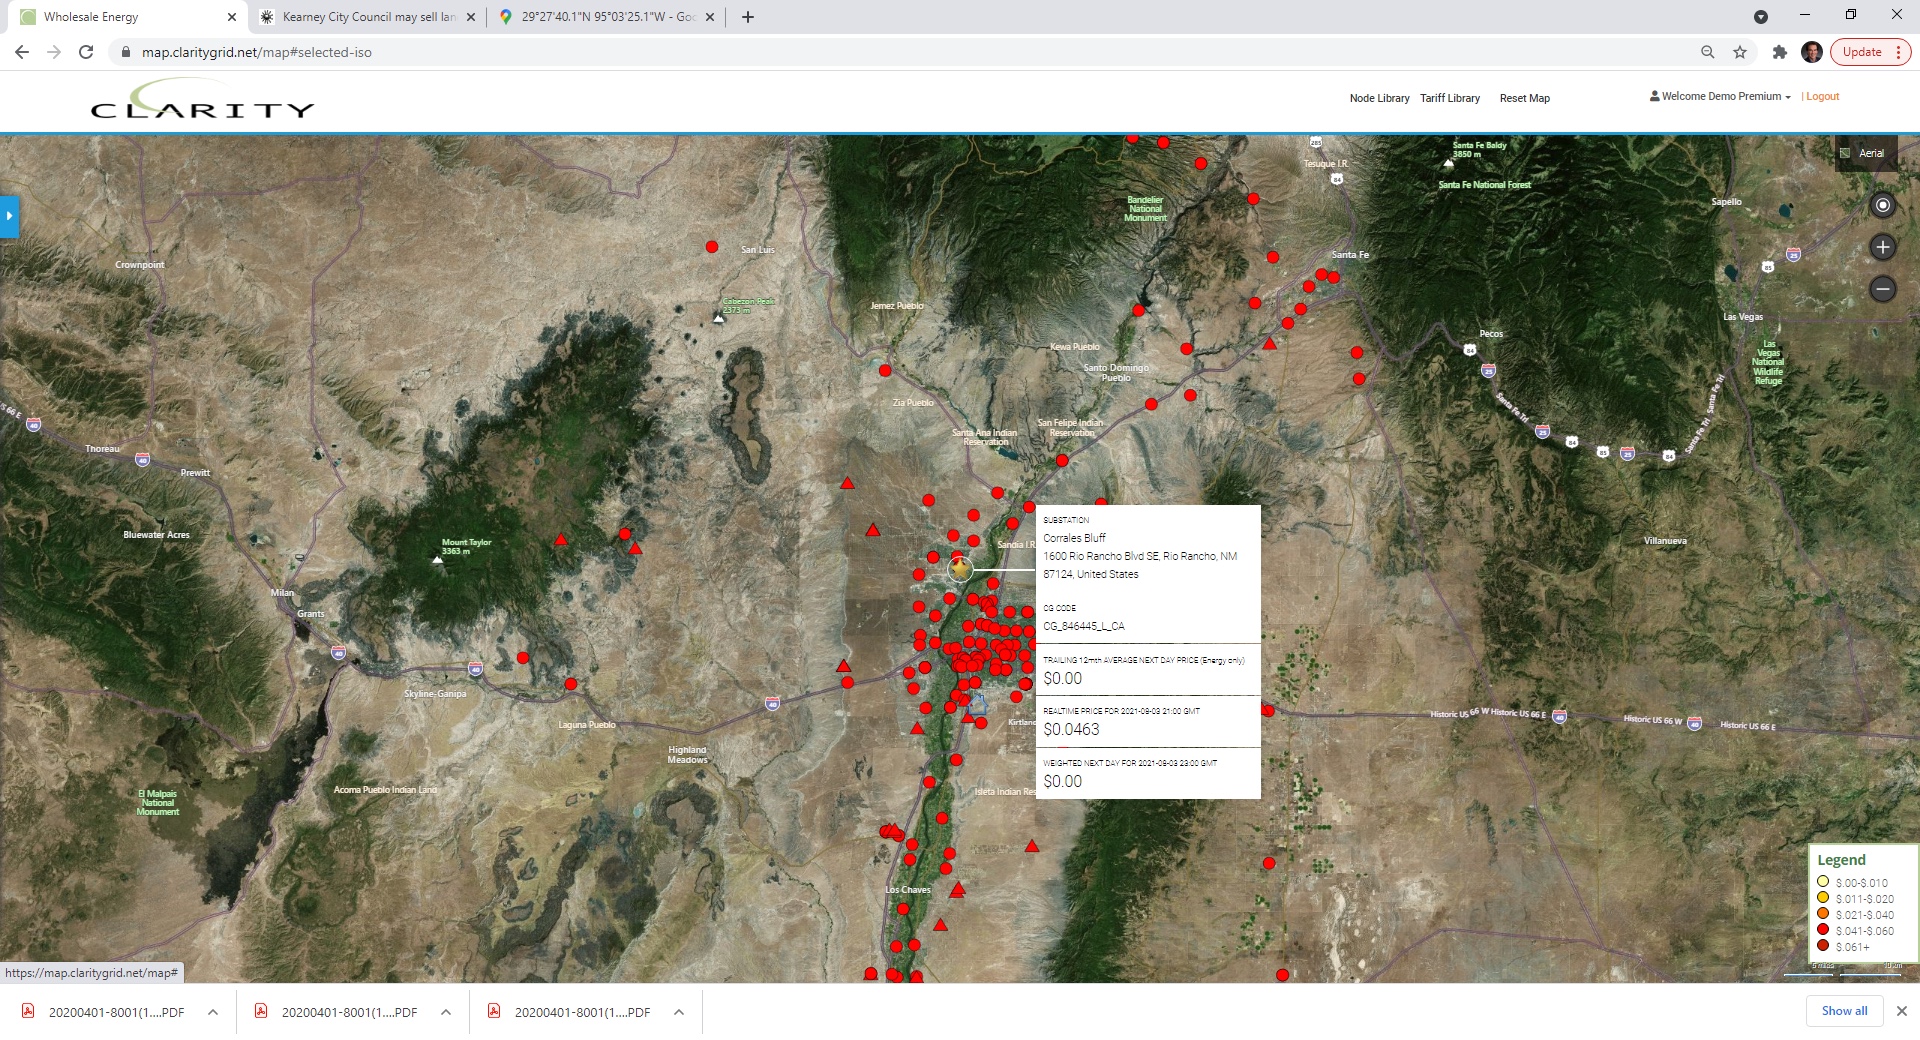
PNM’s Corrales Bluff 115 kV substation supports Intel facility near Albuquerque:
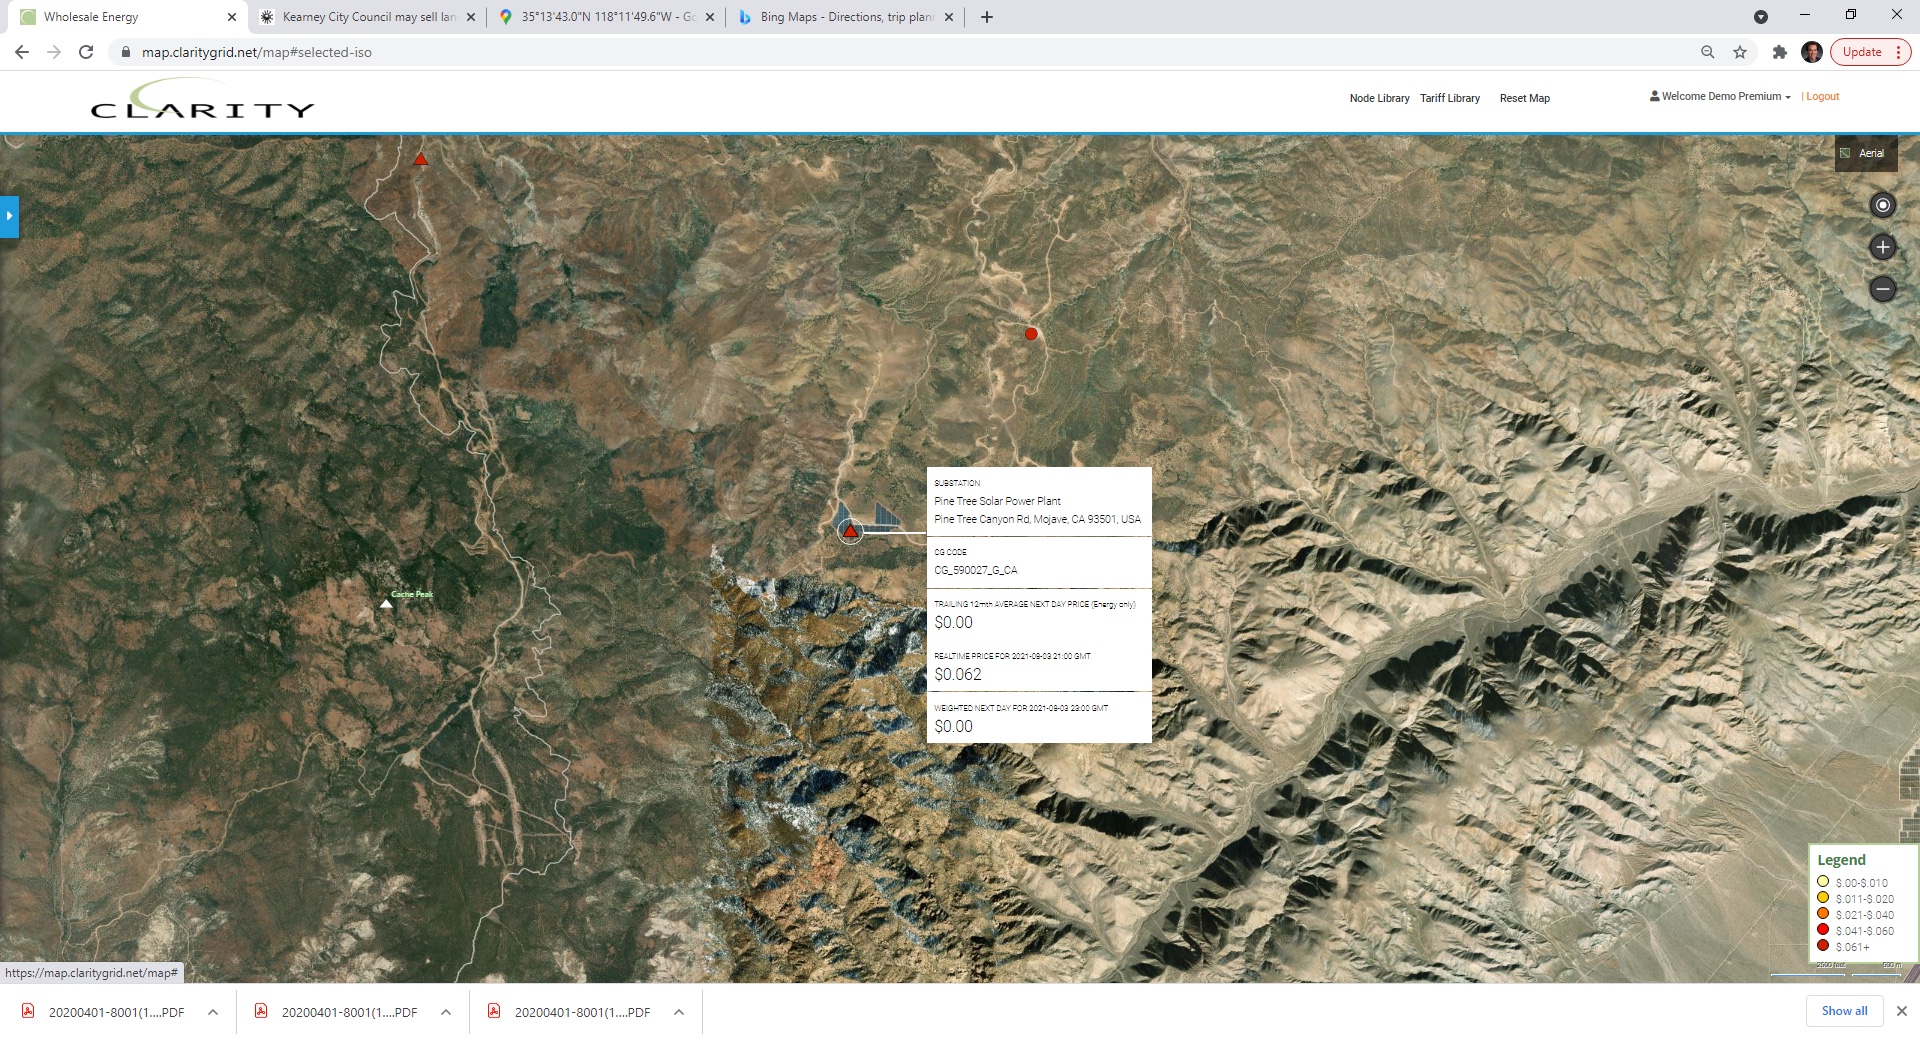
LADWP’s addition to CAISO as separate LBA provides price transparency to its generation mix including Pine Tree Solar Units-1-F: