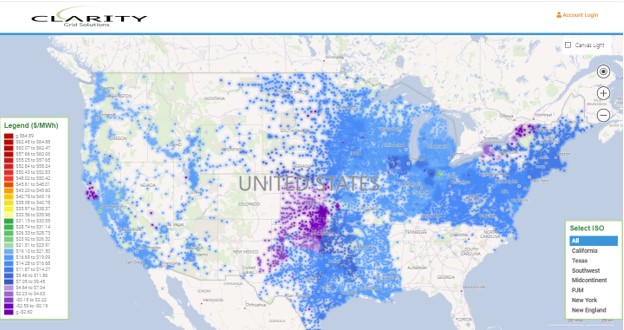
Clarity Grid Solutions maintains a library of over 8,500 Tariffs from over 1,500 individual Distribution Utilities serving the lower 48 US States. Since distribution territory is typically defined by zip code these tariff sets are accessible on Clarity GIS Bing Maps GIS according to this mapping. However, we have also made this library available through a Tariff Library organized by Independent System Operator (ISO) for ease of access. Until recently all nodal data (which is placed geographically on the platform by latitude/longitude) was only accessible by point and click on the map. Given that over 66,000 individual nodal prices are captured, this method made consumption of nodal data cumbersome as the User needed to hunt and peck through the map to find areas, or node types, of interest. Reducing displays of different types of generation, or substations for a particular zone or utility, was not possible and limited use cases for the data and applications of the platform.
As you may have guessed we have now introduced a Nodal Library at the top of the Clarity UI Introduction which mirrors our Tariff Library in format. Simply click on “Select ISO” to begin by examining nodal data for one region, see below:
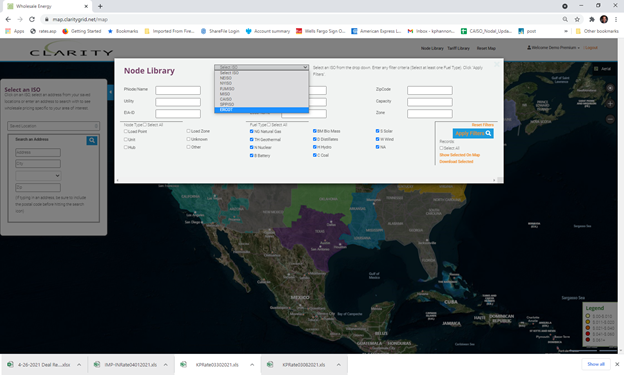
Begin by selecting Node Type at left, Load at far left and Generation at right and organized by fuel type. You may also search on any of the fields displayed: PNode Name, Utility, Zip Code etc. The most popular searches may include Generation by Fuel type by ISO Region, see all Wind Generation in SPP, for example below (note that Node Type “Unit” must be selected);
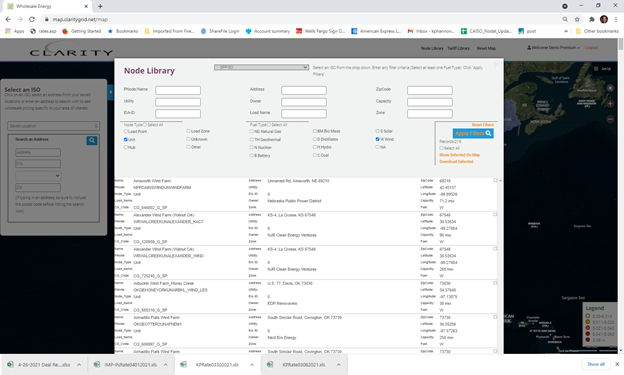
A list of all nodes fitting the criteria will then be displayed, by clicking “Select All” and “Show on Map” visualization of all nodes chosen for this data layer are displayed:
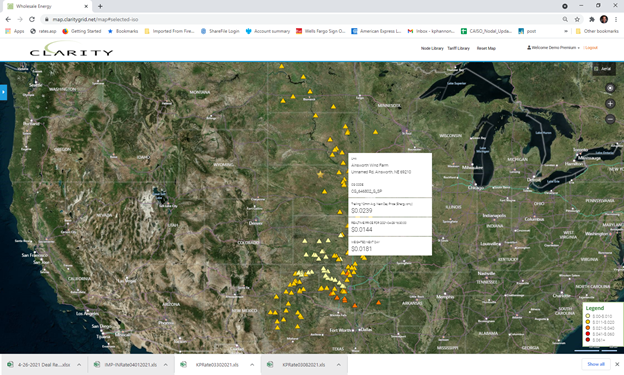
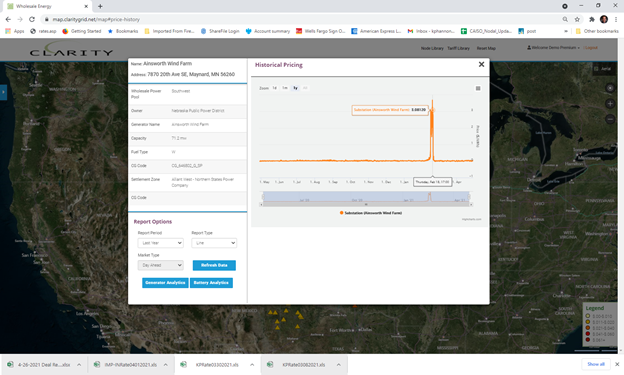
The User may click on that node and all data available previously shown (including metadata on capacity, ownership and fuel type) in point and click on map is made available:
Similar functionality is now also available for load nodes (buses/substations) with the ability to view all load points for a utility’s distribution system can be segmented. For example, see below all Entergy owned substations in MISO:
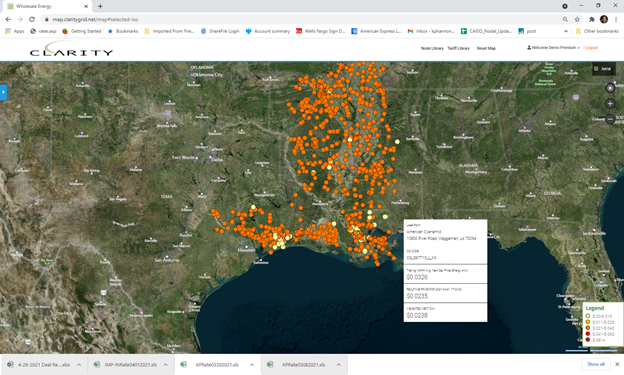
In this way a developer, or trader, or regulator can identify the geography of and individual utility’s distribution territory.
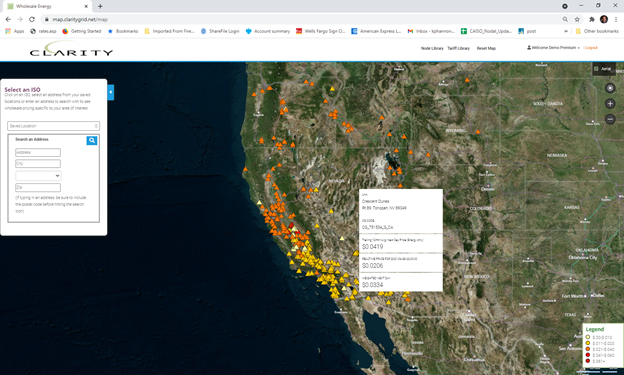
Similarly, all Solar Generation in CAISO can be displayed to make solar economics simulations easier, including all Extend Market Utilities territories included in the CAISO Generation mix: see below:
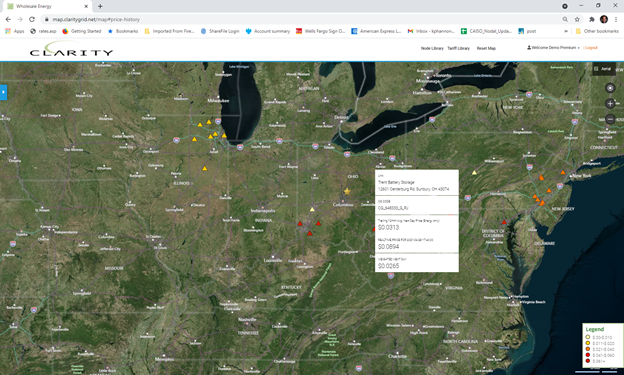
Finally, to round out generation types of most interest, Battery, while also technically both Load and Gen can be displayed across a given ISO, in this case PJM. In this case the Trent Battery Storage facility in Sunbury, OH is shown in wide and narrow scale:
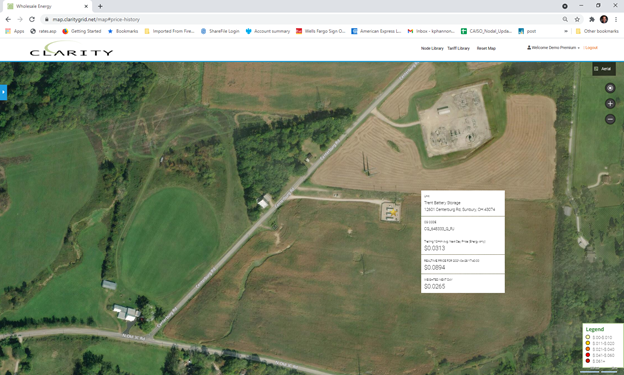
As with all nodes, sitting behind the nodal point is up to 10 years of ND Energy Pricing data with ancillary pricing at the node soon to be added.
To sign up for a demo of all data available simply visit www.claritygrid.net and sign up for a trial.