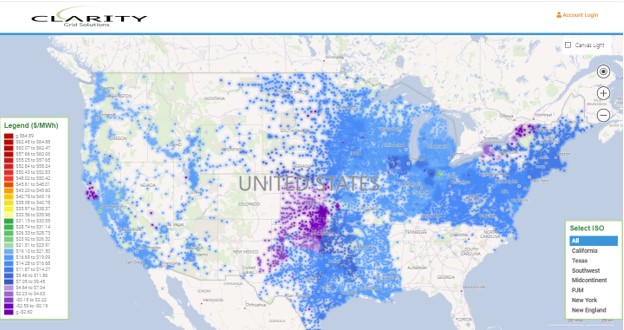
Clarity Grid Price Node Map
Clarity Grid Web presents price node locations, types, and prices in a familiar map-based interface. Clicking on the map, entering an address, or entering only a zip code presents the substations and generation locations as markers on the map.

Current real time price levels are color-coded on the markers for instant visual comparison of prices across a zip code.


Clarity Grid Toolkit allows you to:
- Get Accurate Price Comparisons based on Actual or Simulated Usage Data
- Compare your current monthly costs to alternative tariff offerings
- Compare energy costs against alternative wholesale indices (nodal, index, hub)
Bring the power of the Clarity Grid Toolkit to your systems with the Clarity Grid API.
Clarity Grid Solutions, Inc.
11757 Katy Freeway, Ste 300
Houston, TX, USA 77079